First published on Wordpress in October 2022.
Everything has been in and running for a little over 6 months now, so I thought it would be useful to have a look at some statistics. I’m going to take a ‘clean’ dataset that runs from April through to September as this removes some of the things that were happening in February and March around inverter changes and heat pump optimisation etc. That means this will primarily be about solar generation and what that has achieved, with a little bit of commentary about smart-meters. You’ll need to wait (as will I!) to find out how the heat pump affects the data over the winter.
Everything has been in and running for a little over 6 months now, so I thought it would be useful to have a look at some statistics. I’m going to take a ‘clean’ dataset that runs from April through to September as this removes some of the things that were happening in February and March around inverter changes and heat pump optimisation etc. That means this will primarily be about solar generation and what that has achieved, with a little bit of commentary about smart-meters. You’ll need to wait (as will I!) to find out how the heat pump affects the data over the winter.
Temperature
As the heat-pump has not really been on in the period we are looking at I will dispense with a detailed breakdown of temperature data. Basically the house has been perfectly fine apart from when we had the heat-waves when, as for almost all of us without air conditioning, the house was hot.
We did however get asked by a friend whether the solar panels above the attic had any effect on temperature in there. I had no idea. I assumed they would make it a bit hotter, maybe…. So I stuck a Govee sensor in the attic and garage (a similar environment but with no panels – although also without loft insulation). The chart below shows the results – data collected every 30 minutes and aggregated per day. I’ll be honest, I’m not really sure what we can say from this. It did get hotter in the attic, but I think it would anyway. Honestly, I don’t think the panels make any difference, but if you have other thoughts then let me know.
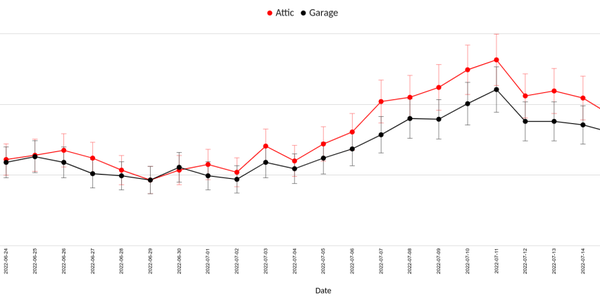
Maximum temperature in the attic and garage (24 June – 16 July 2022)
Energy Usage
The first thing to do is understand the overall picture of the summer – the following lists the total amount of measured electricity usage, the solar production, what was pulled form the grid and what was sent back to the grid.
- Total usage: 2353 (kWh)
- Solar production: 5303 (kWh)
- Grid usage: 216 (kWh)
- Solar generation sent to the grid: 3059 (kWh)
Electricity generation and usage (Apr – Sep 2022)
Overall, not bad figures. Before I jump into the breakdown of those, I want to reiterate that usage covers all our lighting, heating, cooking, hot water and ‘fuel’ for the car. Also, when the solar panels are filling the car or the hot water cylinder, this app sees that as general use in the home, so I don’t have a specific breakdown by each usage type (other than the battery). Something for the future maybe.
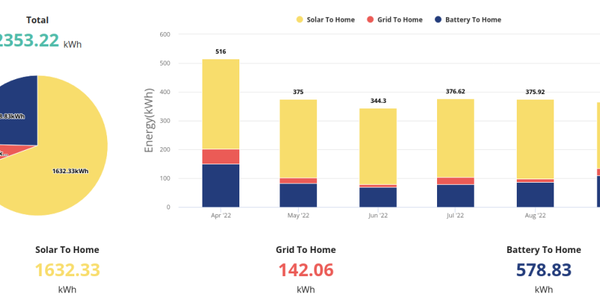
Home energy use (April – September 2022)
As expected, in the above figure we can see more grid energy being imported in April and September. Use of the battery to power the home is also greater in those months as the nights get longer. The majority of the battery use is to keep the house running overnight, with a little bit running the heat pump if that comes on (nb: the heat pump was used sparingly in early April and late September, but not between those times). The solar to home use is relatively stable throughout the months – powering the home, giving hot water, filling the car and filling the home battery.
The eagle-eyed amongst you will notice the increased grid use in July – that’s because I needed to charge the car a couple of times at a quicker speed (due to my poor planning!) so couldn’t just trickle in power from the solar panels.
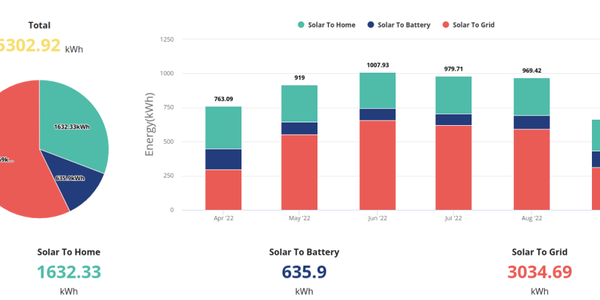
Split of generation data (April – September 2022)
Of our generation through the panels, we topped up the battery and powered the home. We also exported a fair chunk, and the figure above shows that in higher generation months we exported more. No surprises there.
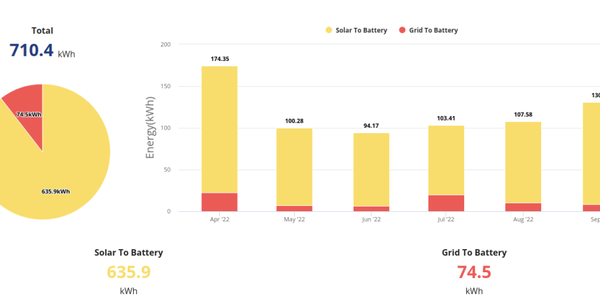
How we filled the battery (April – September 2022)
The figure here shows that we have primarily been filling the battery from excess solar generation. Every now and then the battery gets topped up from the grid if the overnight battery level is below 40%. I think this threshold might be too high given the amount of solar we have, but it’s set at this to ensure that there’s always at least 40% battery capacity to power the heat-pump if needed. Maybe this needs to be set seasonally as the heat-pump is only really being used outside these months. Anyway, given that we store a lot of free energy from the panels, we power the house and car very cheaply and cleanly.
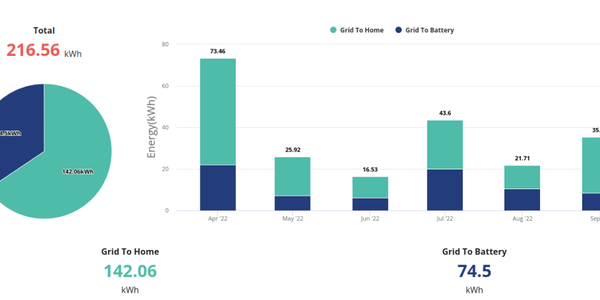
What we pulled from the grid (April – September 2022)
Looking at what we pulled from the grid, the amount going to the battery to reach that threshold is evident. The ‘direct to home’ component will mainly be from charging the car without proper planning, use of the heat-pump in April and September and cooking (we only had our new efficient kitchen appliances from late May onward). The kettle takes a substantial amount of draw, and if the heat pump is on at the same time then it will take that from the grid. We are going to look at getting an induction hob kettle as that draws <50% of the power and heats water as quickly, if not quicker, than our current kettle.
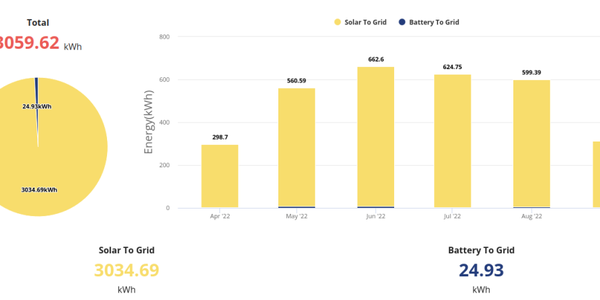
What we gave back to the grid (April – September 2022)
We exported a lot. Due to some paperwork shenanigans our export is limited to 5 kW (you may remember that we have a 6 kW inverter – we can use up to 6 kW on the house-side of the meter), but even with that step-down there is a lot of clean electricity going into the local grid and powering the homes of our neighbours. Happy times.
Money talk
The following plot tells a few stories. It shows daily cost of usage (no standing charge included) based on our smart meter data. Story 1 is that our smart meter was poorly installed and completely failed to connect to our provider for a period between July and August (the blank part of the chart). The usage data shown earlier in the blog was not affected by this as it used independent C-clamps and meters.
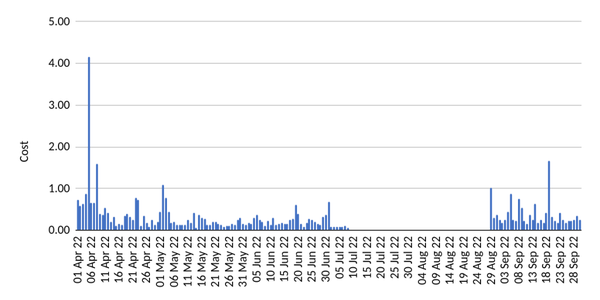
Daily costs (April – September 2022)
Story 2 is that we did something on the 5th of April that used a lot of electric from the grid. £4 in a day – that was filling an empty car to full, during peak hours – very, very bad planning! And story 3, and the best in my opinion, is that our daily costs are low (averaging 33p per day) and remain low across the time period. In terms of bills we’ve also managed to arrange a smart export guarantee payment (took a long time, and it’s still ongoing!) which means most of our export has generated some income too.