Based on Jake Vanderplas' presentation Statistics for Hackers video, section 2 Shuffling
It's almost the same setup as in the presentation, the only missing piece is how to break down binomial data into individual examples (Bernoulli trials).
One way is to represent it with a sequence of k 1s and (n - k) 0s.
For example, n=5, k=2 could be represented as [1,1,0,0,0] since order doesn't matter due to I.I.D. assumption in the binomial distribution.
It's super-simple - no fancy math, just plain shuffling, and it gets the job done.
This approach could be generalized to N groups with minimal modifications, primarily in indexing.
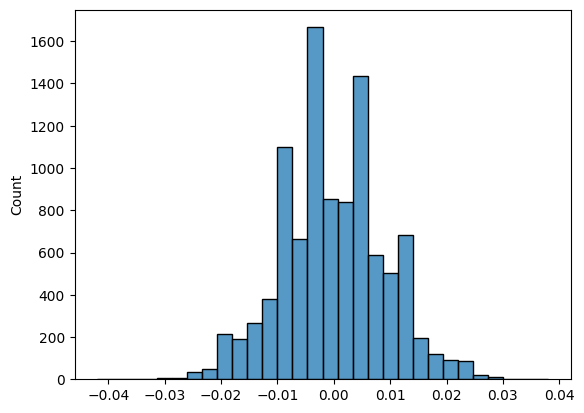
import numpy as np
import seaborn as sns

group_a_clicks = 50    # Number of clicks in Group A
group_a_trials = 1000  # Total impressions in Group A
group_b_clicks = 40    # Number of clicks in Group B
group_b_trials = 1000  # Total impressions in Group B

ctr_a = group_a_clicks / group_a_trials
ctr_b = group_b_clicks / group_b_trials
observed_diff = ctr_a - ctr_b

# expanding binomial data into Bernoulli trials
group_a = np.concatenate([np.ones(group_a_clicks), np.zeros(group_a_trials - group_a_clicks)])
group_b = np.concatenate([np.ones(group_b_clicks), np.zeros(group_b_trials - group_b_clicks)])
pooled = np.concatenate([group_a, group_b])

sim_diffs = []
for _ in range(10000):
    np.random.shuffle(pooled)
    sim_a = pooled[:group_a_trials]
    sim_b = pooled[group_a_trials:]
    sim_diff = np.mean(sim_a) - np.mean(sim_b)
    sim_diffs.append(sim_diff)

sns.histplot(sim_diffs) # below

# could make it two/one tail test based upon problem
p_value = np.mean(np.abs(sim_diffs) >= np.abs(observed_diff))

print(f"Group A CTR: {ctr_a:.4f} ({group_a_clicks}/{group_a_trials})")
print(f"Group B CTR: {ctr_b:.4f} ({group_b_clicks}/{group_b_trials})")
print(f"Observed difference in CTRs: {observed_diff:.4f}")
print(f"P-value (permutation test): {p_value:.4f}")
Ouput
Group A CTR: 0.0500 (50/1000)
Group B CTR: 0.0400 (40/1000)
Observed difference in CTRs: 0.0100
P-value (permutation test): 0.3343