So it turns out that Lewis Carroll was obsessed with designing a better voting method. One well known problem is similar to the rationale for Ranked Choice Voting systems we have today: how do you account for the fact that the person who gets the most votes might not be the most broadly liked?
Carroll proposed a number of alternative voting methods to bring races to a more satisfactory conclusion. One was a version of the “method of marks”. Each voter is given a number of points or “marks” to spread across candidates as they see fit. They would give the most marks to their favourite candidate. But they might also give a few to acceptable alternatives. This would allow voters to express both the fact of their support and its intensity.
Polarising figures like Mr Trump would attract lots of marks from some voters, but none from others. They might therefore lose to choices that earned a few marks from everyone. “This Method would, I think, be absolutely perfect,” Carroll wrote in 1873, if only voters were “sufficiently unselfish and public-spirited” to reserve some marks for their second or third choices. But in practice, he thought, voters would “lump” all of their marks on their favourite candidate—if only because they worried that others would do the same.
Carroll never really solved this dilemma. But another person at Oxford, Lionel Penrose, made some progress. Penrose's insight was that individuals in small groups can have a surprisingly large effect on the outcome.
To see why, imagine a committee of three people—call them Tom, Dick and Harry. Their votes can in principle fall eight different ways. (A proposal can gain support from all three or none. It could win backing from Tom and Dick alone; Dick and Harry alone or Tom and Harry alone. Alternatively, these same three pairings could oppose it.) In four of these combinations, Tom can change the outcome, turning a knife-edge victory or defeat into its opposite. A voter’s chances of finding themselves in this pivotal position serves as a good index of their “power”. So in a small three-person committee, their power is four out of eight or 50%.
The table below illustrates the below example. You can see in each of the highlighted cells where Tom's vote may prove decisive.
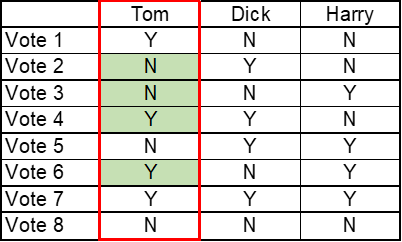
So in a group of 3, individual voter power is 50% (4 of 8 combinations). However, this doesn't hold for larger groups. Voter power actually shrinks proportionate to the square root of the size of the group rather than the size of the group itself. If you made the above example a 9 person group (3x), voter power goes down by only less than half.
Penrose apparently wanted to apply this insight into voting at the United Nations.
Giving every country a single vote, regardless of its size, was undemocratic. The obvious solution was to award votes in proportion to population. But that would give big countries too much clout, Penrose argued.
He instead proposed a middle way between the two. Each country should be allocated a number of votes corresponding not to the size of its population, but to the square root of its population. The population required for one thousand votes might be one million. For two thousand, four million. For three thousand, nine million. To put it another way, the population required for a given number of votes should be that number multiplied by itself (or squared).
There's another body that suffers from this dilemma -- the United States Senate. What might that body look like today if we reallocated the votes among Senators based on state population? Well, we can use the 2020 Census, take the square root of population for each state, and determine how many votes each state should get (divided equally between two Senators) in a 100 vote aggregate body.
Here's a look at the impact of a pure population-based adjustment vs. a quadratic approach for the largest state (California) and the smallest state (Wyoming) by population.
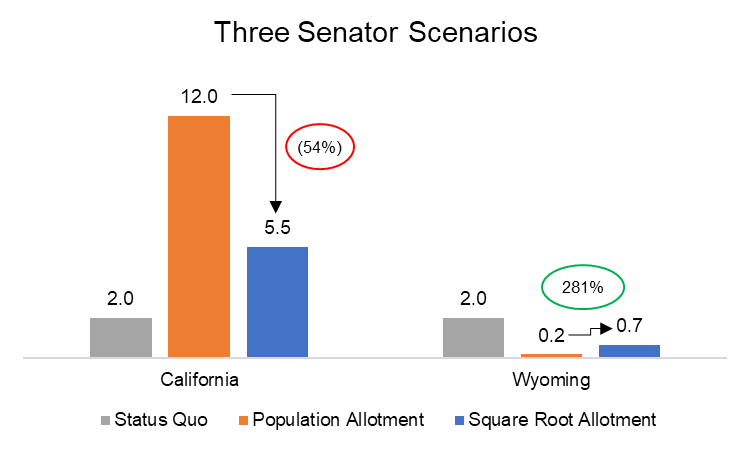
Going from population to square root lowers California's vote percentage by 54%, while in Wyoming it increases it by 281%. Wyoming retains some voter power but less than half of what it gets in the status quo; reflective of its smaller population.
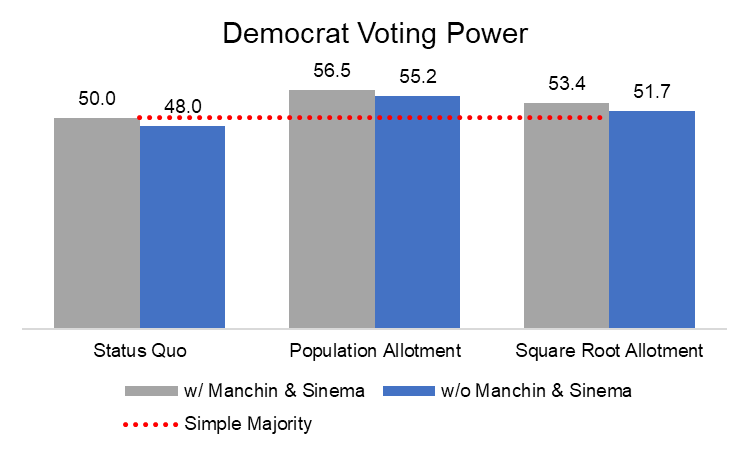
What does this look like based on the current composition of the Senate between the two parties (assuming the independents Angus King and Bernie Sanders are allocated to the Democrats)?

You can see the large state population advantage of the Democratic Party getting greater recognition.
In this latest cycle, Democrats have been very disillusioned by Senators Manchin and Sinema, the two most moderate Senators in their caucus. What does the above chart look like if they voted against the party? Well, Arizona and West Virginia rank 14 and 39, respectively, in terms of population. Each Senator in those two states would get around 1.1 and 0.6 votes in the square root allotment. The Democrats would be able to carry majority votes without them.
Of course, the Senate composition is always changing. Also, Sunbelt states which tend a bit more conservative are growing faster than traditional Blue states. Lastly, many Senate votes require supermajorities, which require bipartisan effort or legislative chicanery in any arrangement.
This isn't just pie in the sky. Carroll and Penrose have been synthesized into a concept called quadratic voting. A voter would get a budget of credits to spread among ballot choices. If they wanted to cast 3 votes for something they felt really strongly about, for instance, they could spend 9 of their credits (3 squared). Obviously the tradeoff is you have less credits to devote to other issues you want to stump for. This type of voting has been deployed internally at Microsoft and within political caucuses to determine what legislative priorities should get the most focus.