For those who want more than what "simple" maps offer, I included more details:
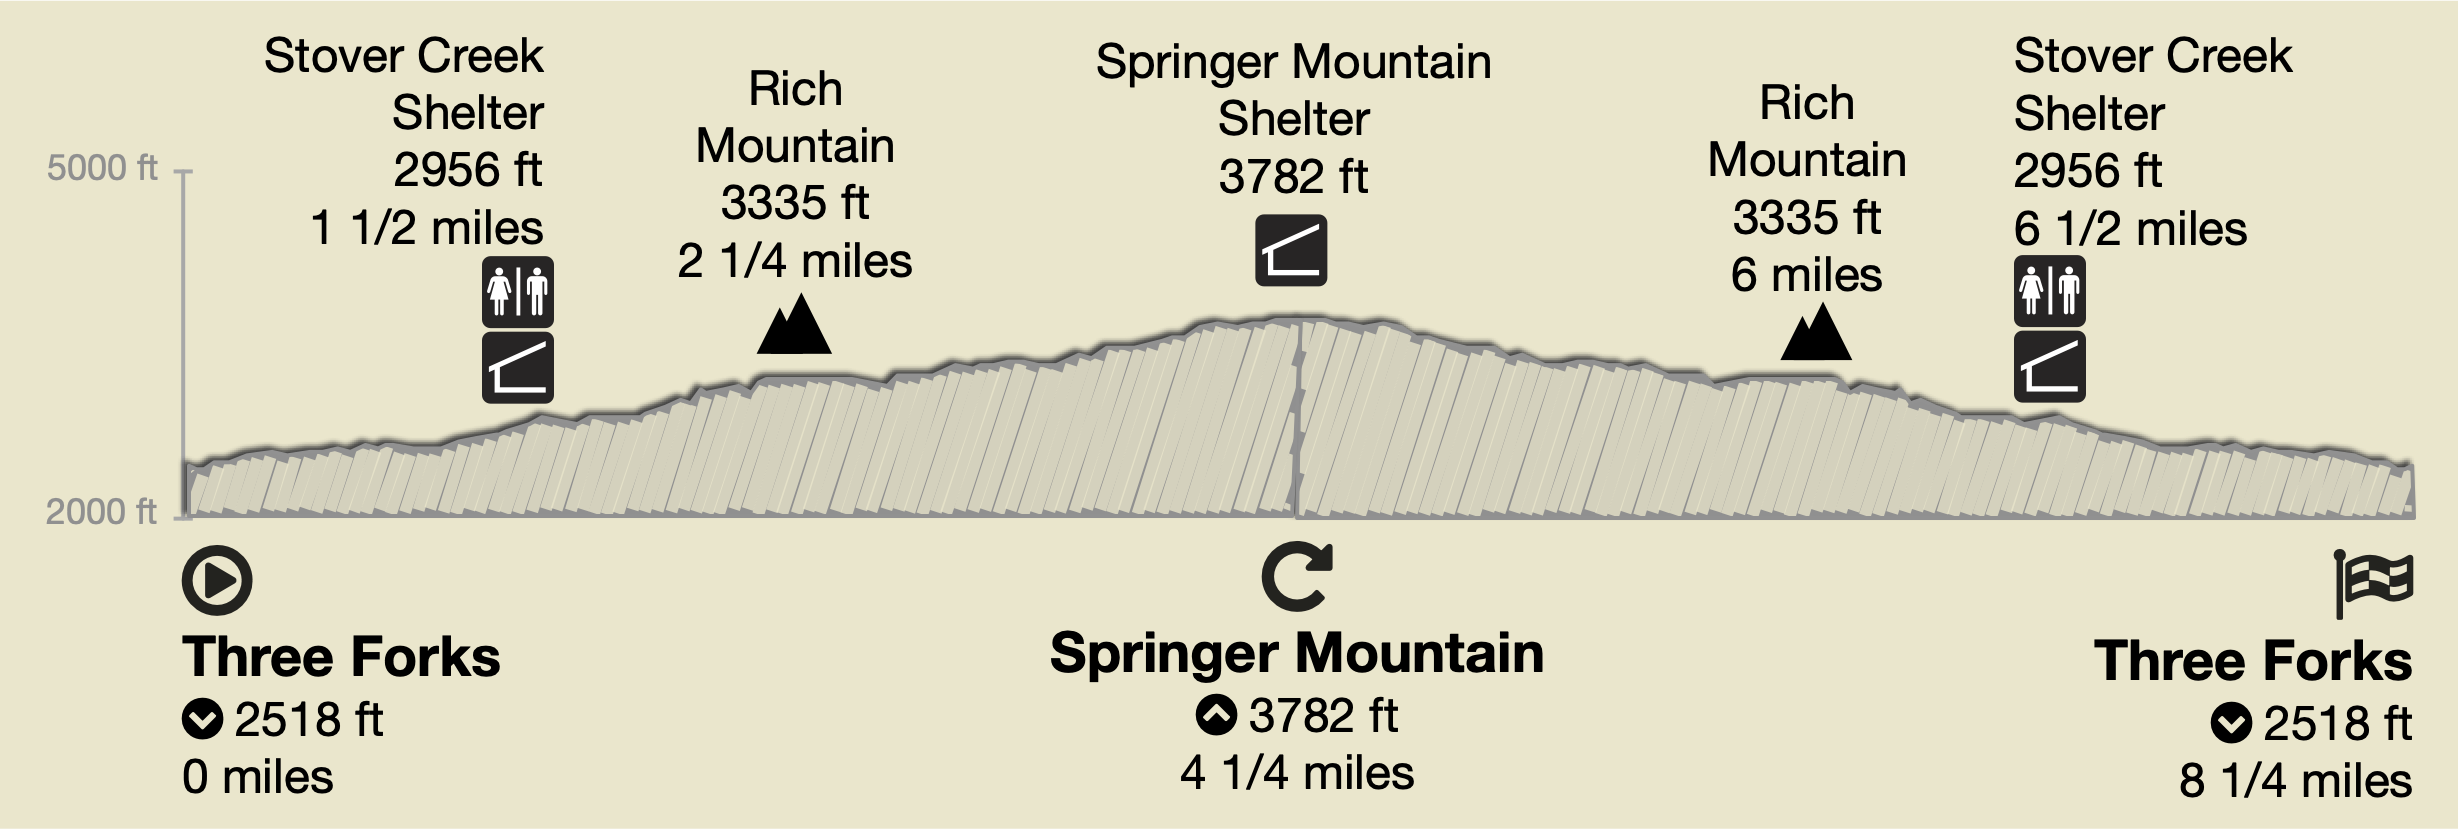
Elevation profiles:
I learned that the elevation profiles needed consistent bounds (top and bottom elevations) for people to understand how much elevation change a section had compared to the other sections. I decided on 2000' to 5000' since all sections in Georgia are between those elevations.
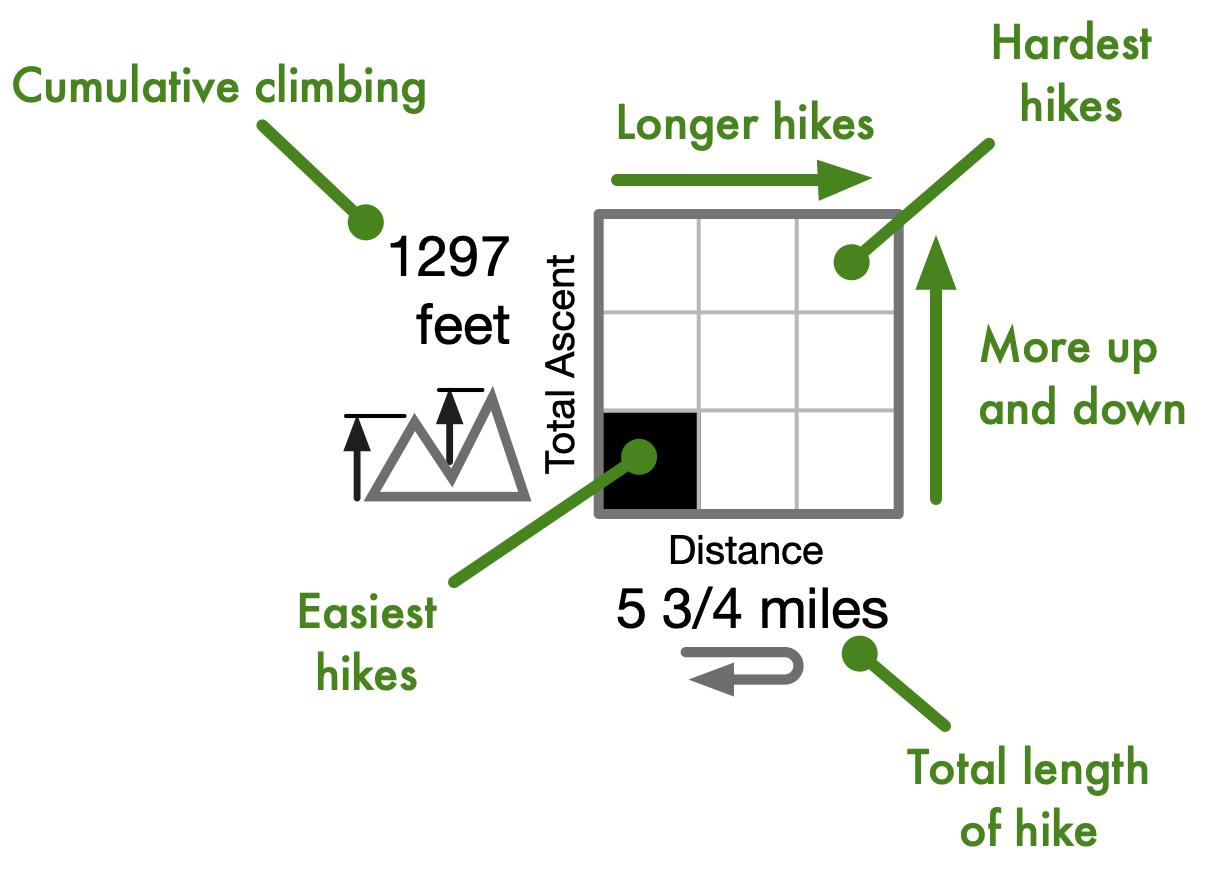
Difficulty index:
I wanted a way for novice hikers to be able to understand the "difficulty" of a section. For me, that's defined as "how many steps I'm going to have to take" (i.e., distance) plus "how much upping and downing I'm doing to have to do" (i.e., cumulative climbing). Here's what I cam up with.
This chart is intended to be a quick indication of section difficulty. Hikes in the lower left are the easiest, and ones in the upper right are the hardest. The cumulative climbing is the total feet of climbing, not the difference between the highest and lowest points on the trail (elevation change) — cumulative climbing is always a larger number than elevation change and is a better representation of the difficulty of a trail section.
QR code linking to an online map service:
(gaiagps.com at time of publishing) Shortened URL and QR code: Pointing the camera app on most modern phones will convert the QR code to a link in the phone browser. The link goes to an online map for the section. If the QR code doesn’t work for them, there’s a shortened URL they can type in the browser.