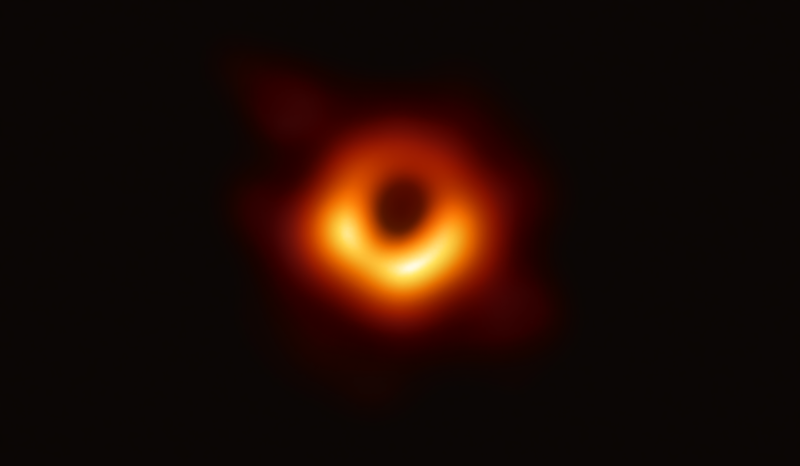
I've recently read an article from the PingCAP talking about how Key Visualizer improved the distributed database observability to discover unknowns. The article started with a famous picture and I think it's a really good topic start point. Let me show you this picture as well. Do you remember this picture taken in 2019?
A black hole has been captured together with its shadow in an image for the first time in human history. For a long long time, when we talk about a black hole, we can only imagine what it might look like, but now we have the ability to measure a black hole using different wavelengths of light with the help of the Event Horizon Telescope(EHT). So we gained the observability of a black hole...
In this article, I want to share my understanding of distributed system observability and its challenges in the new era - cloud and microservices.
I majored in automation engineering in college. I learned the observability definition from my control theory course. The concept of observability was introduced by the Hungarian-American engineer Rudolf E. Kálmán for linear dynamic systems. When we say the system is observable, it means that we can determine the system's behaviors based on its output. For the simplest example, you can use the temperature controller to control the heater or air conditioner because your house temperature is observable since it can be measured directly by the temperature sensor.
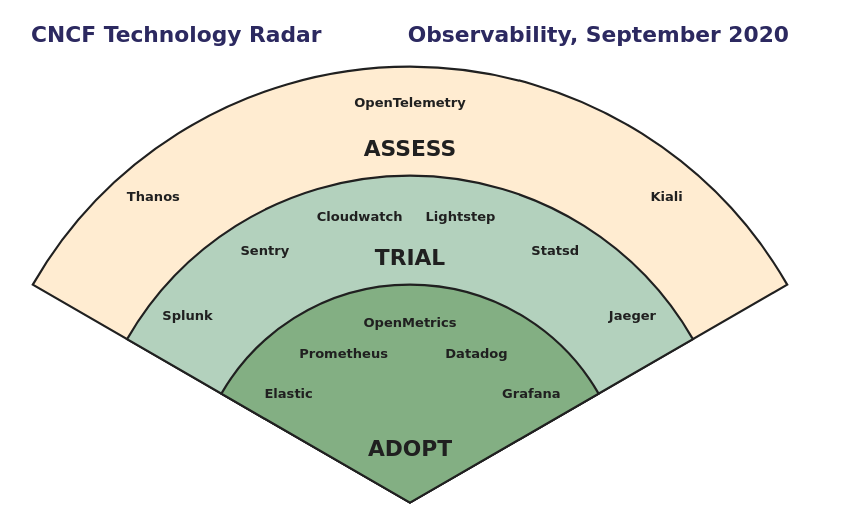
Basically, Observability is a measure of how well the internal states of a system can be examined and learned from its external outputs. After I joined the software industry, I found this word is heavily used in the software monitoring domain as well. The systems that we want to observe are services, applications, IT devices, networks, etc. The system output data normally uses three types of telemetry data: metrics, logs, and traces. These telemetry data tell us the answers to what(metric), why(log), and where(trace) questions. By analyzing these system emitted data, we gain the observability of the system. Many monitoring solutions including commercial products, open-source tools can collect these data and present these data to developers/SREs to help them inspect the system healthiness, find the performance issues, analyze the root causes during the outage. The following graph is a observability survey result from CNCF:
The most commonly adopted tools are open source.
There’s no consolidation in the observability space.
Prometheus and Grafana are frequently used together.
I am particularly interested in the second bullet point. Why is there no consolidation in the observability since it seems like observability is a well-defined problem? From the survey, it says:
Many companies are using multiple tools: Half of the companies are using 5 or more tools, and a third of them had experience with 10+ tools. Observability inherently requires looking at the data from different views to try to answer questions. Different tools have strengths in different techniques and integrations, which may be the reason why end users end up with multiple tools. Once adopted, it may be difficult to switch from one set of tools to another or to even consolidate. For most end users, observability is not their core business, so the investment needed to switch tools is often not easily funded. This may be a large reason why there are so many “Adopt” votes in this radar.
However, I think the above statement only describes the "symptom" instead of the "root cause".
In the old days, the observable state of a simple service indeed can be easily described by several telemetry data since its architecture is not complex. Nowadays, as cloud and microservices become more popular and our systems become more complex - for example, Bytedance has more than 50,000 online microservices, we are getting into chaos. Many articles that discuss observability like to quote "There are known knowns" fromDonald Rumsfeld to describe the challenges in observability. The large reason why it's hard to consolidate the tools is that we are not able to define the chaos system easily, i.e. there're so many unknown unknowns - things we are neither aware of nor understand.
I believe engineers are aware of this, so we keep adding more telemetries, creating new tools to reduce these unknown unknowns. However, what's the principle we should follow or where should we go when we keep adding more data? Are there any side effects? Will we just become lost due to the date explosion? Is there a more direct method to describe a system's internal state?
I think if we have the ability to take a picture of the system just like the black hole picture, we can solve these challenges.
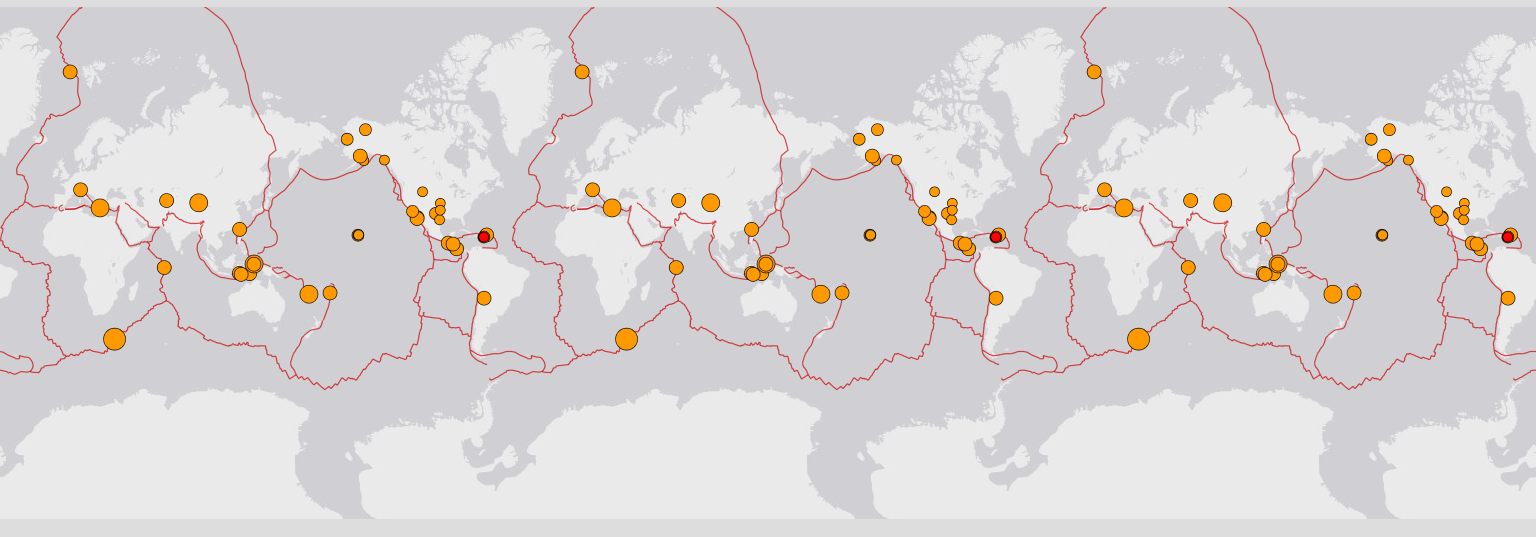
The traditional methods of visualizing the telemetry data include graph, time series, stat, gauge, heatmap, etc. Those visualization helps us to find patterns among the data. The experienced engineer is able to construct the whole picture of the system in mind using those visualizations. A better observability tool can facilitate this process. However, we need a direct way to "take the picture" and easily interpret these "pictures". For example, the following picture shows the latest earthquakes globally, what do you see?
Yeah, the earthquakes happen along fault lines, cracks in Earth's crust where tectonic plates meet. Why can we see this immediately? Because of Pattern. The red curved line is where plates meet.
This applies to the software systems as well. You can change the world map to your product and the earthquake is the problem service.
So the observability tool we should build need to show us a "picture" with patterns that we can easily interpret. People already started building these tools. For example, the Key Visualizer I mentioned at the beginning, and Flamescope built by Netflix. Flamescope uses a sub-second offset heatmap and flame graph to analyze periodic activity, variance, and perturbations. Of course, AI-based pattern recognition can help identify the patterns from our telemetry data easier. I would imagine there will be more tools emerging in the future using machine learning to solve the observability challenges. Let the machine understand the machine. As a human, we just need to look at the pictures to gain the full observability in chaos :)