Market breadth measures the degree of participation & the conviction in the overall mood of the underlying index. A positive market breadth is said to happen when more stocks are advancing than are declining.
Among many ways to measure this, one simple way is the % of stocks trading above a certain moving average. When most of the stocks are trading above a specific moving average, the market breadth is termed strong.
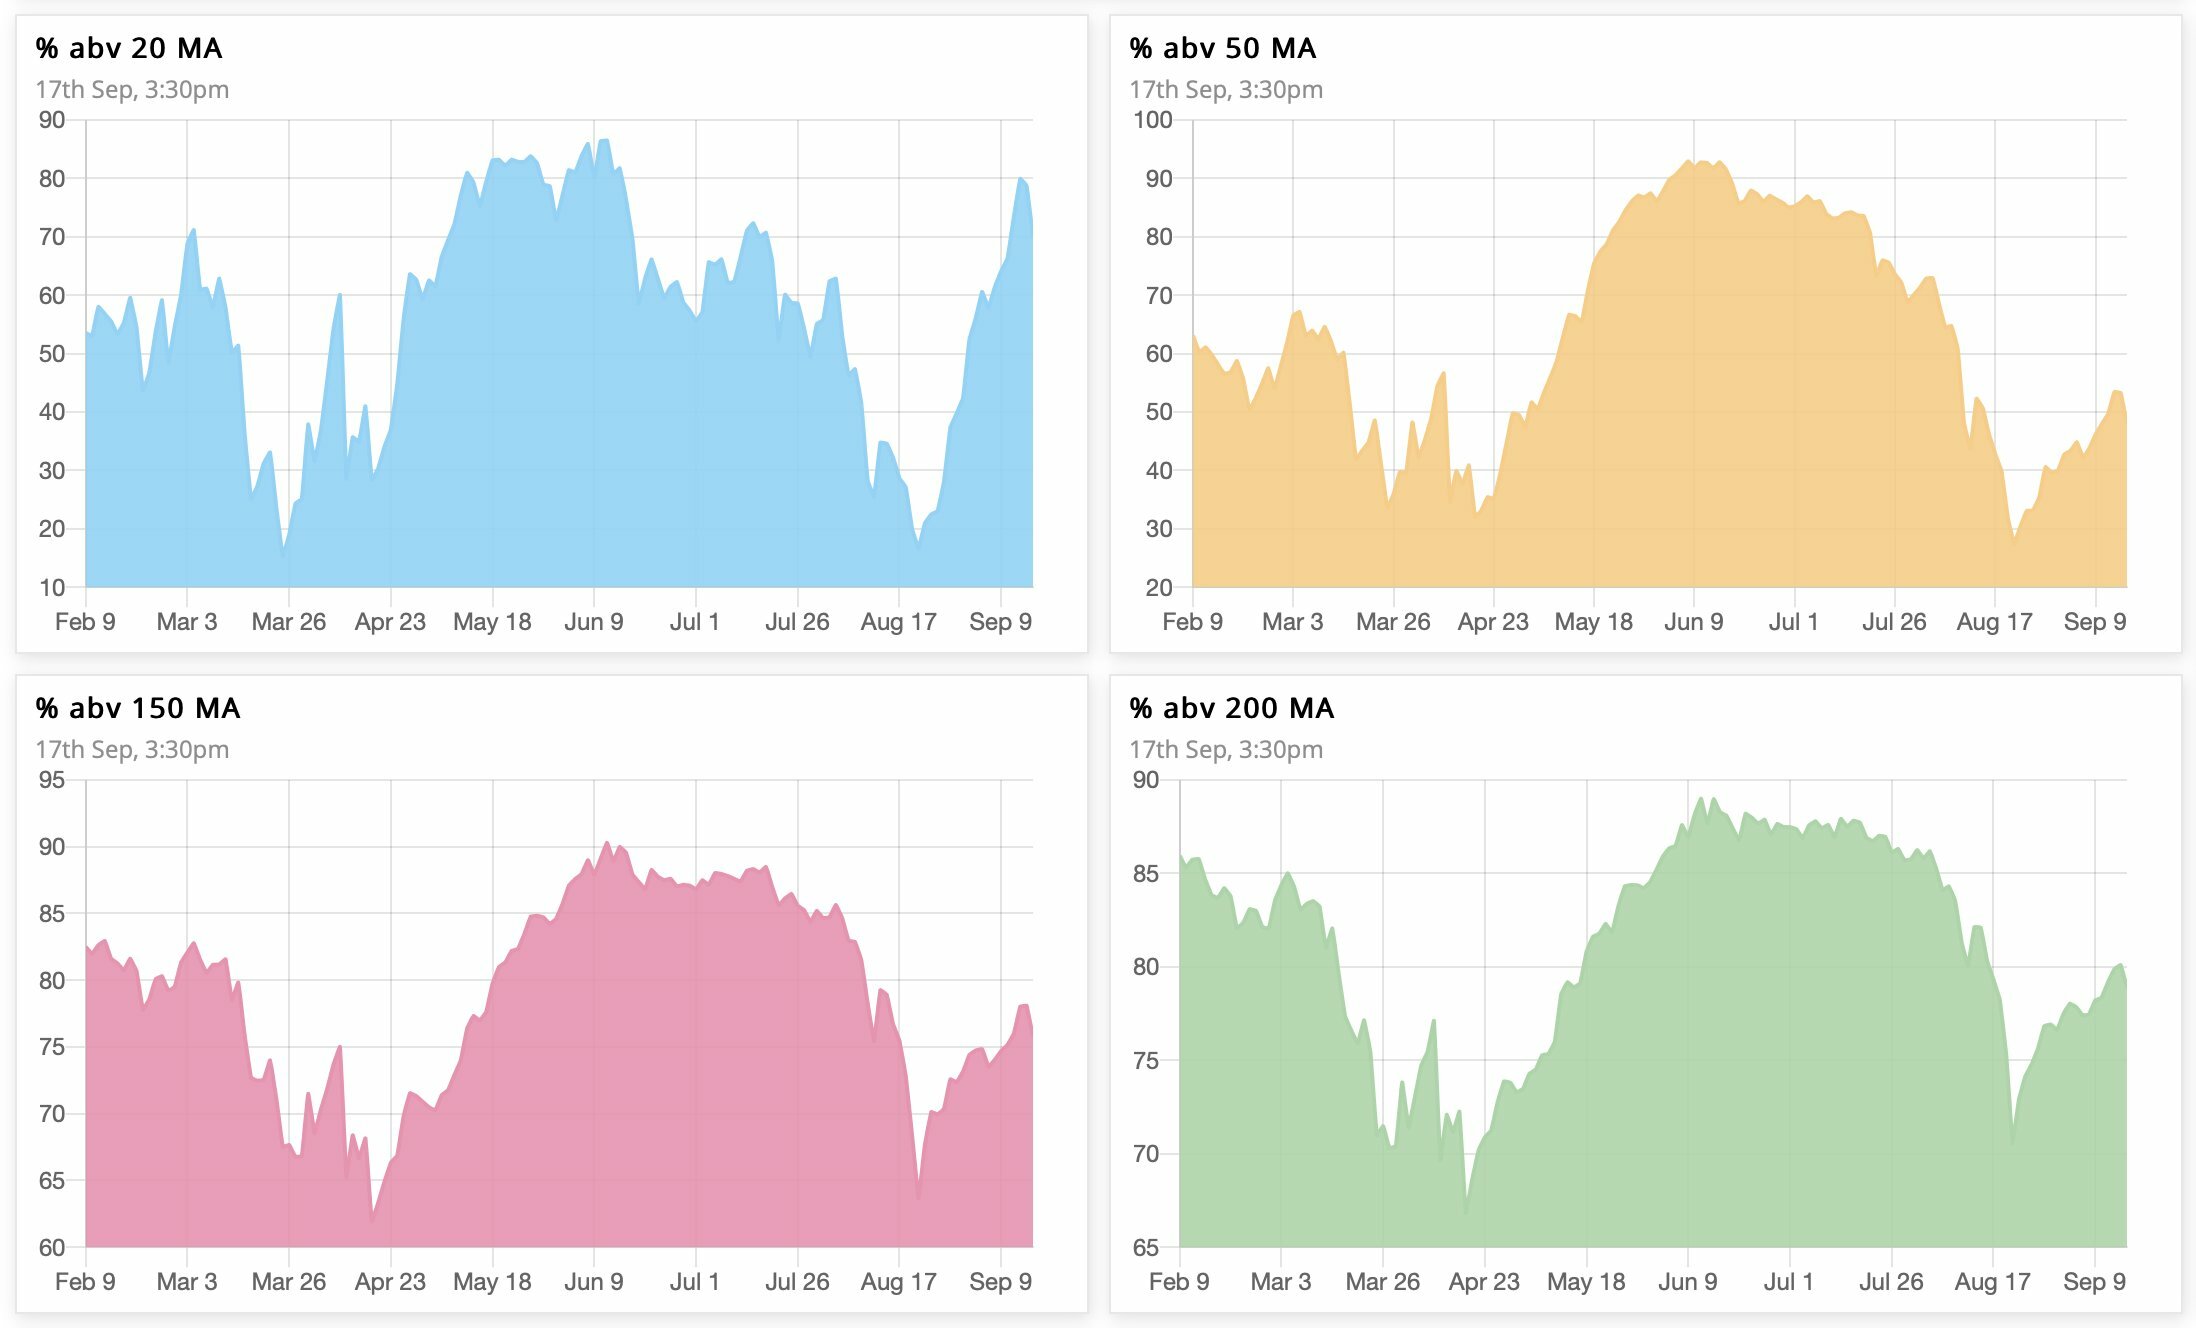
I use 20-day & 50-day MA for short to medium term timeframes, & 150-day & 200-day MA for medium to long-term timeframes.
Bullish/bearish bias
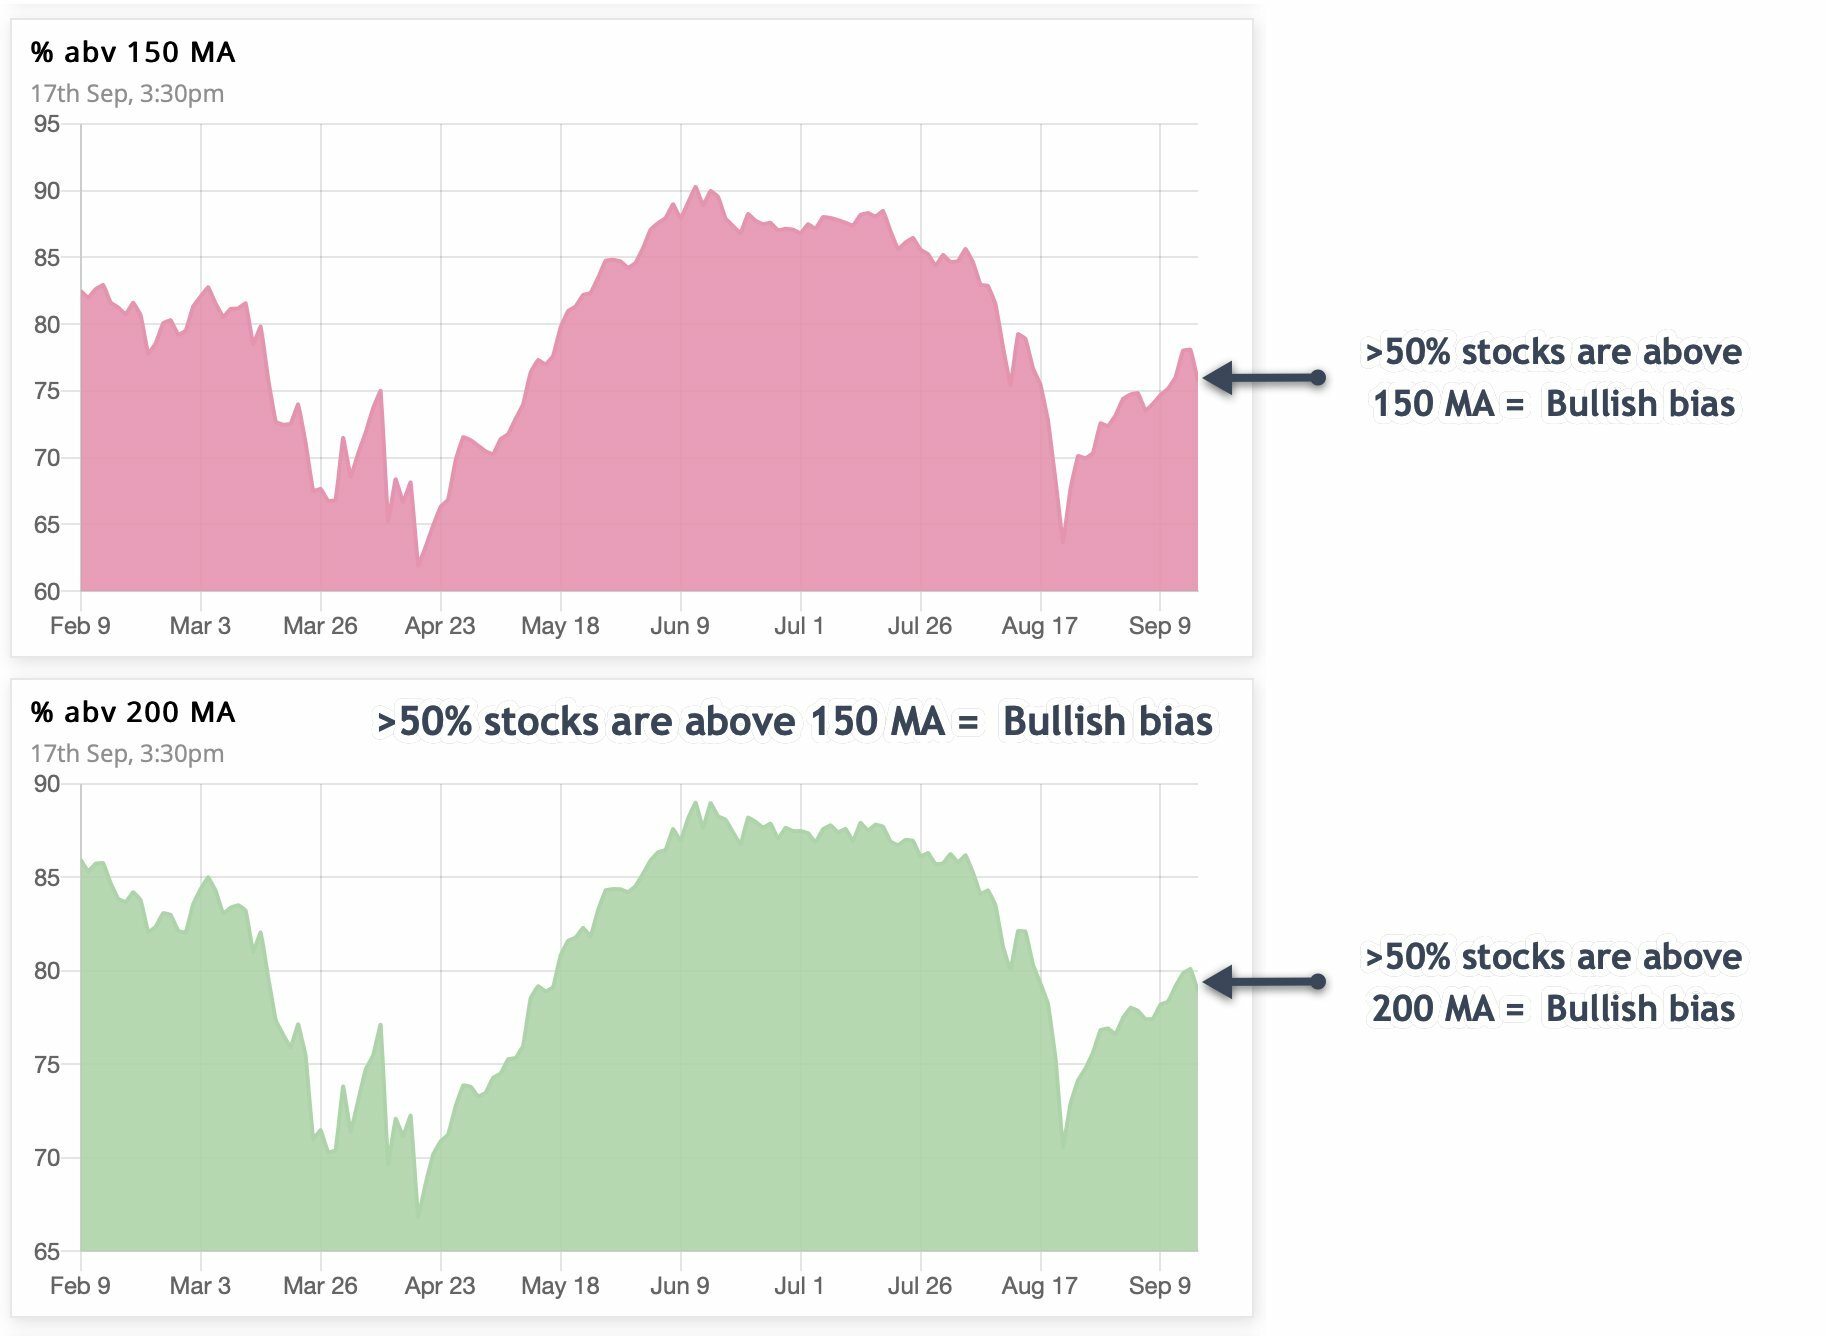
We have a bullish bias when >50% of stocks are above their 150-day and 200-day MAs. We have a bearish bias when <50% of stocks are above their 150-day and 200-day MAs. We do not see the longer-term timeframes for oversold or overbought levels.
Similarly, short-term bullish & bearish biases are when the market breadth of 20-day & 50-day MA is above or below the 50% threshold, respectively.
Oversold/overbrought
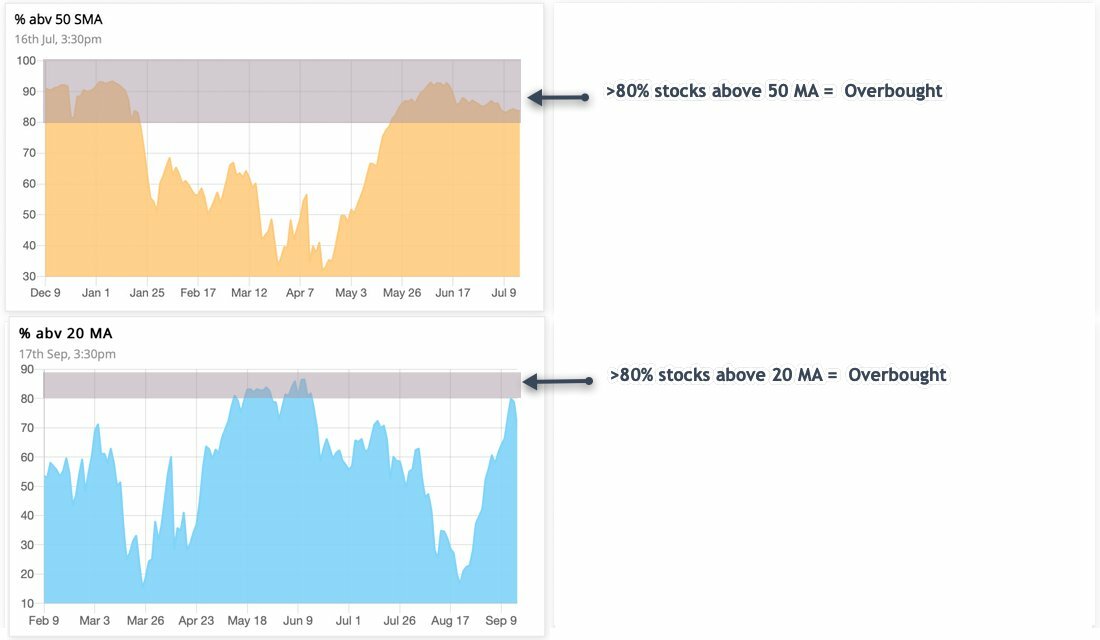
We also look at short-term timeframes for overbought and oversold levels. Values above 70-80% are considered overbought and readings below 30-20% are deemed oversold. One can change these to 75-25 or even 90-10.
Oversold/overbrought market breadth does not necessarily indicate reversal, but rather an exhaustion. This can get resolved by either a price correction or a time corrrection.
The breadth can remain in overbought zones for a long time while the price is in a strong uptrend — and equally so at oversold zones during a strong downtrend. Rather, overbought and oversold trend represent strong trends that can produce continuation patterns.
When the market breadth is extended/overbought, we need not rush to exit all our holdings & sit out in cash. We instead need to:
- Ideally: Avoid initialting fresh longs
- Next to ideal: Avoid fresh breakouts
- At least: Reduce position size
Fresh buys
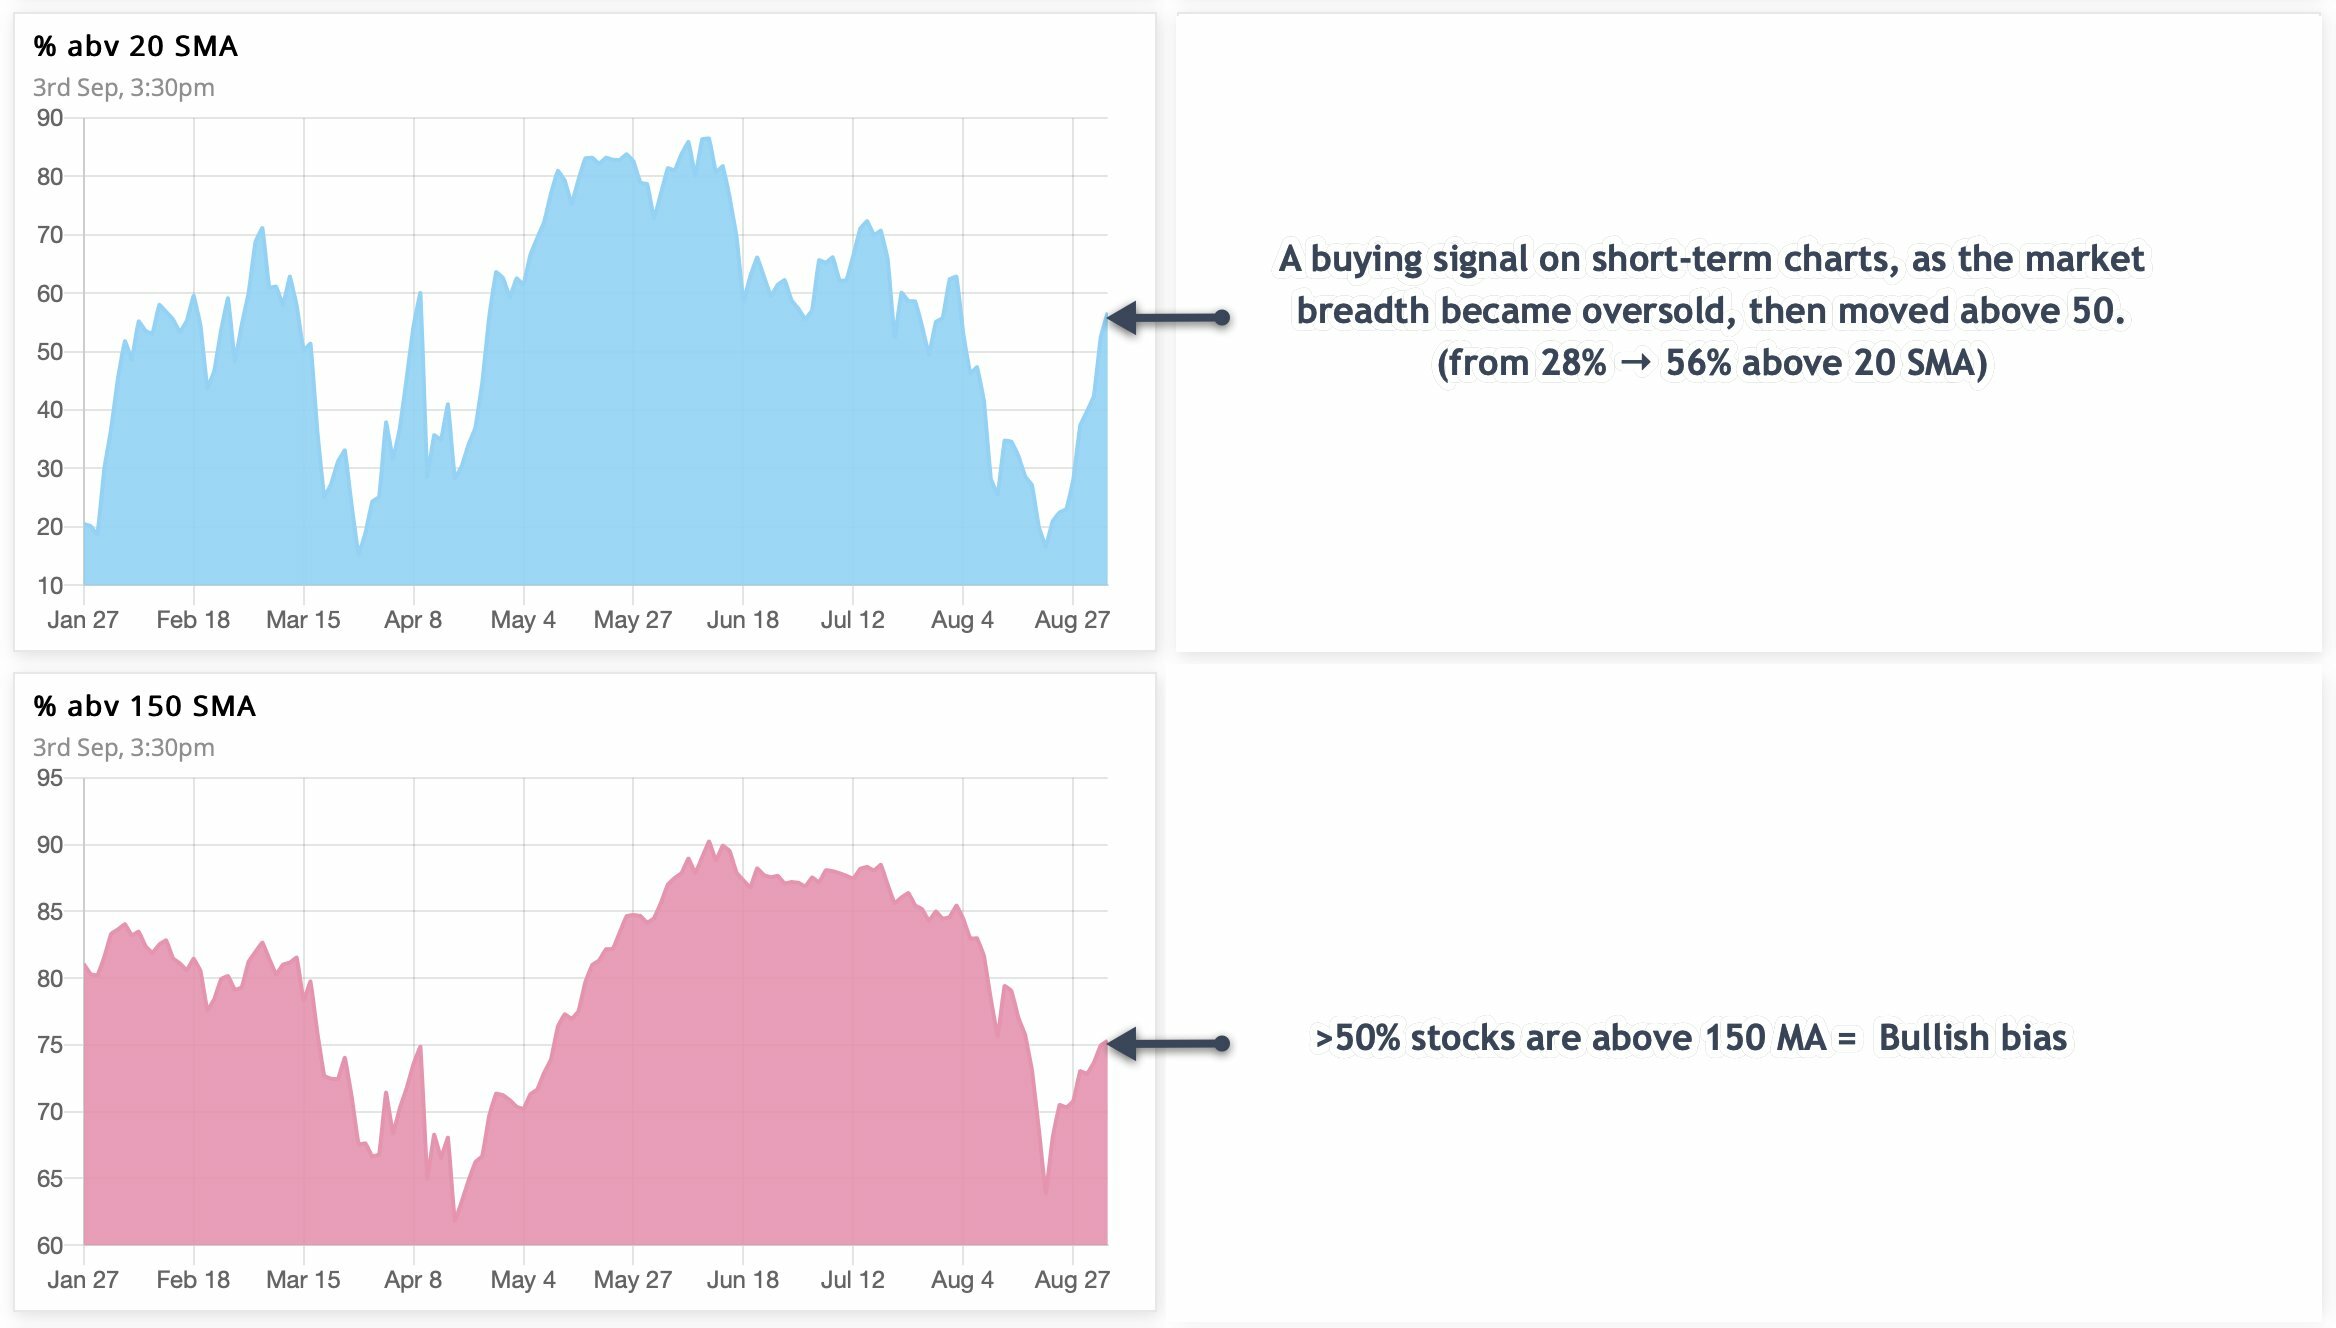
With >50% stocks already above 150 & 200 MA, we get a signal for initiating fresh longs on short-term timeframes if the 50MA market breadth first goes oversold & then crosses above 50%.
Swing-trading
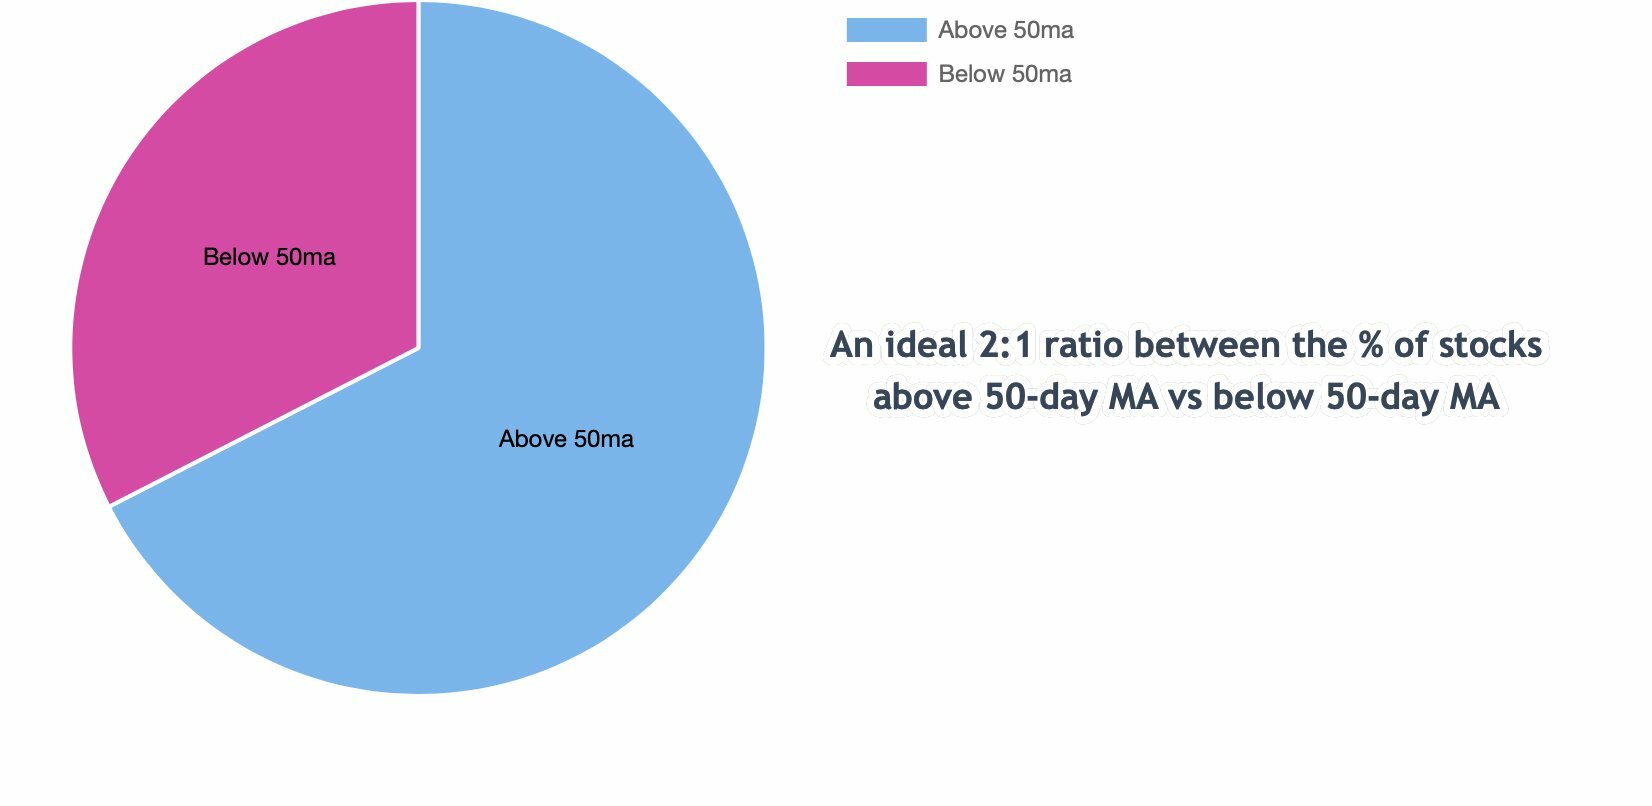
For swing-trading, we would love to see a 2:1 ratio between the % of stocks above 50-day MA vs below 50-day MA. A ratio below 1:1 is not healthy & the probability of getting big moves is less.
Divergence
Can the index rally, but the market breadth fall? Yes, when a small number of stocks are rallying so much that they are moving the entire market higher. Similarly, a bullish divergence is when the underlying index moves lower but the market breadth does not breach its previous low.
A rally with decreasing market breadth is less sustainable. A person with a bullish view would love to see the market rallying with increasing market breadth.
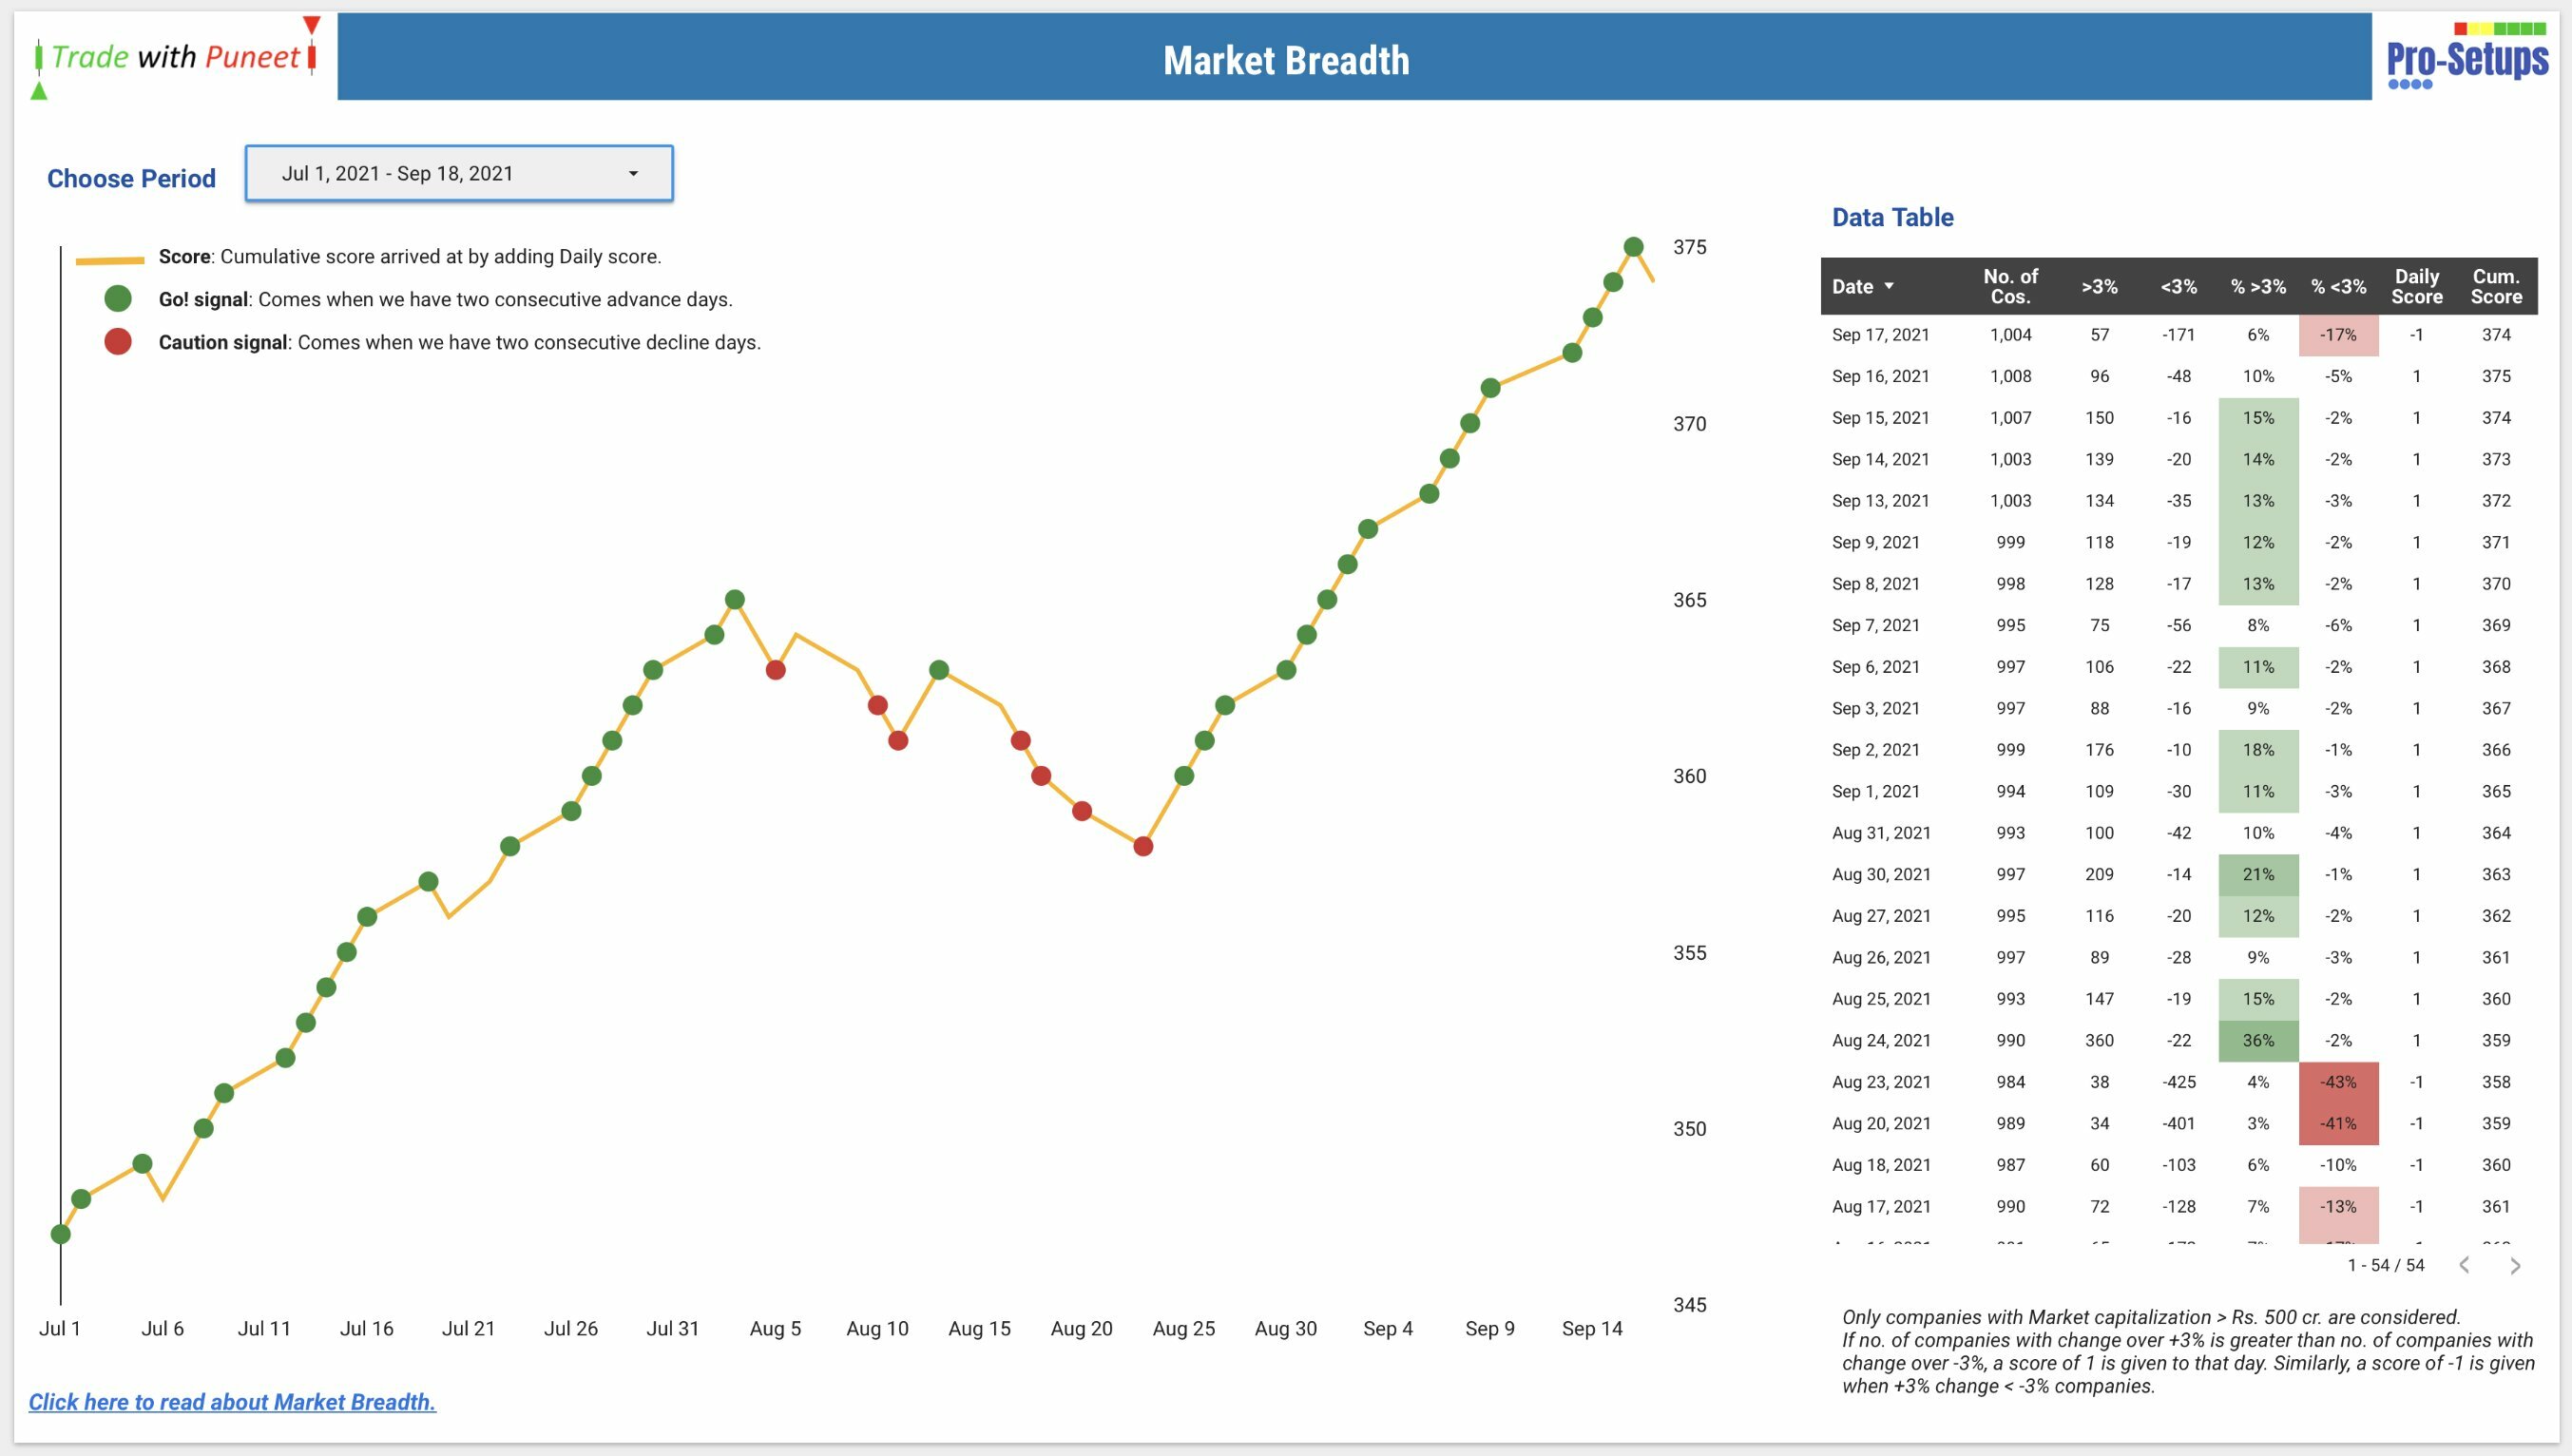
Using Adjusted Advance Decline ratio (A/D ratio), compareing the number of stocks that are closing 3% positive versus the stocks that are closing 3% negative compared to their previous close.
Thanks to @varunmehta for asking me to write this up. If you'd like to know when I publish something new, just enter your email address below and you'll get the latest sent direct to you.