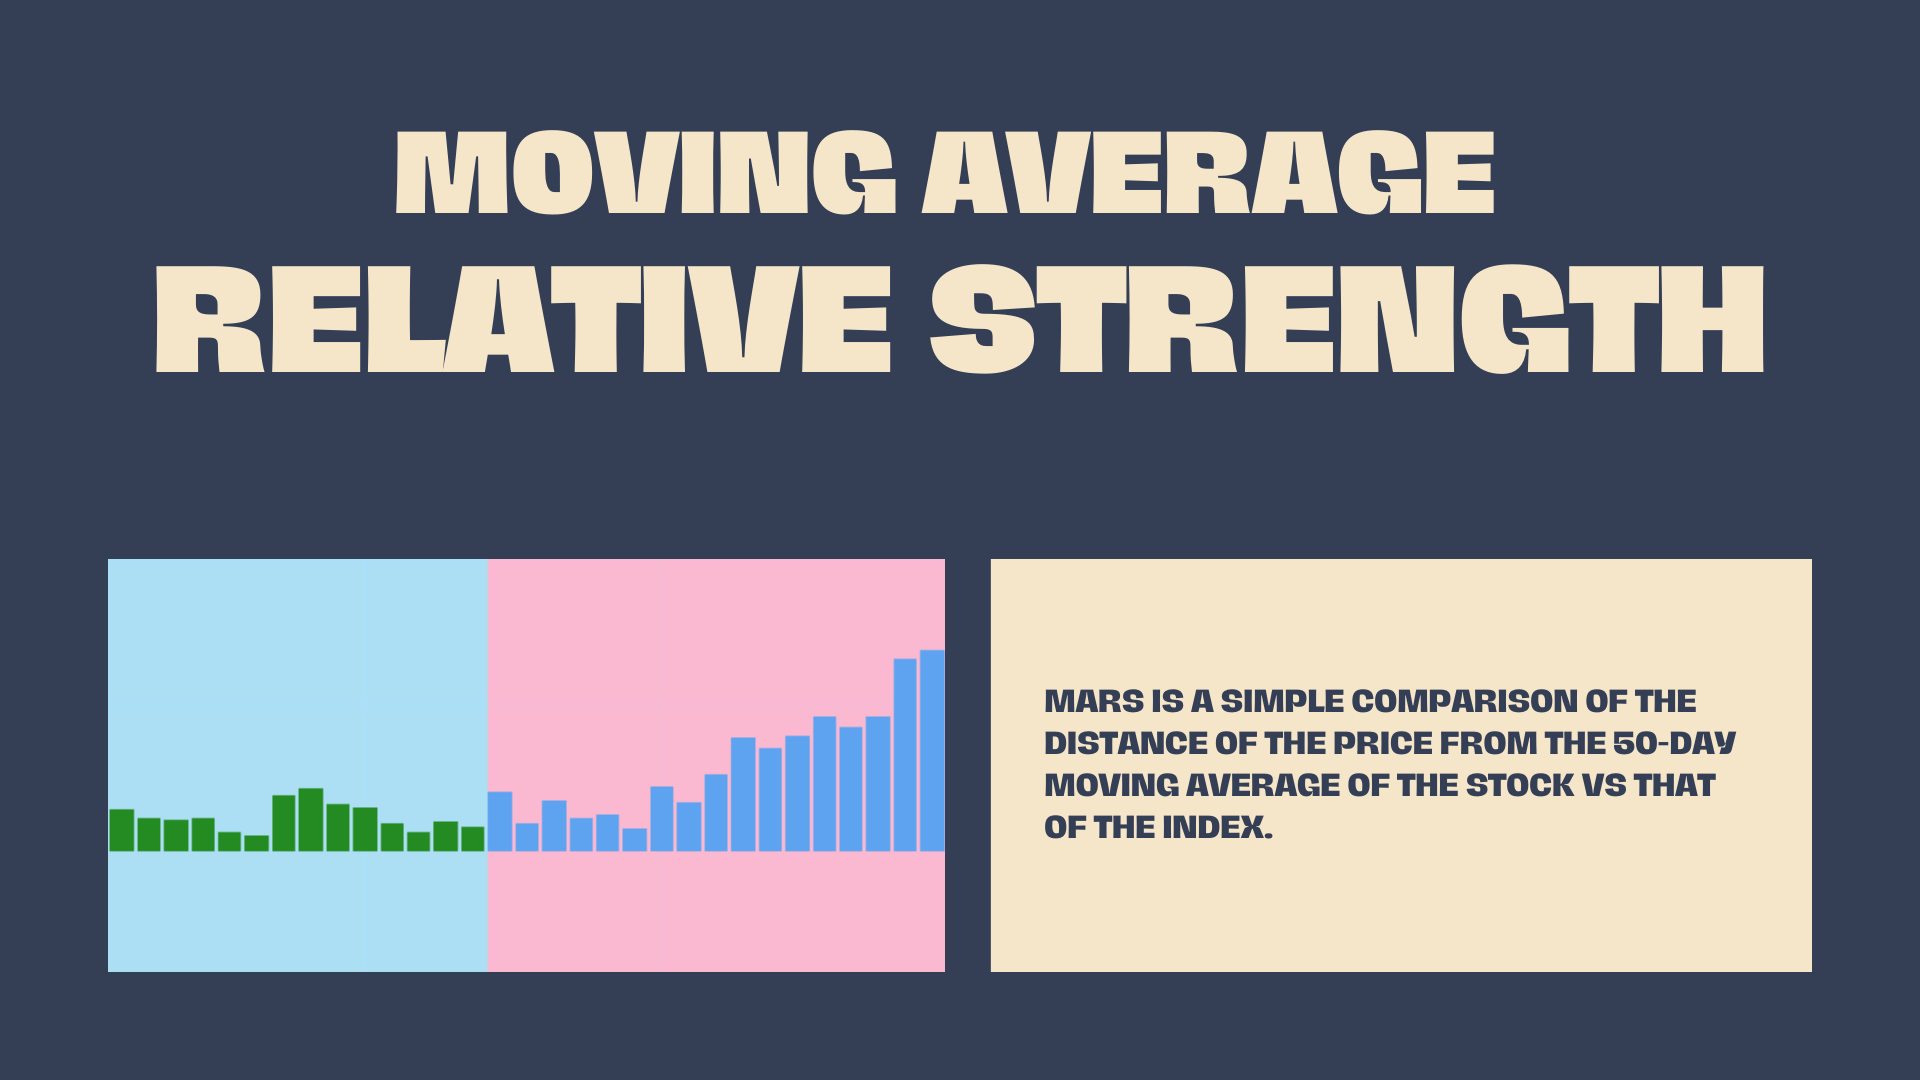
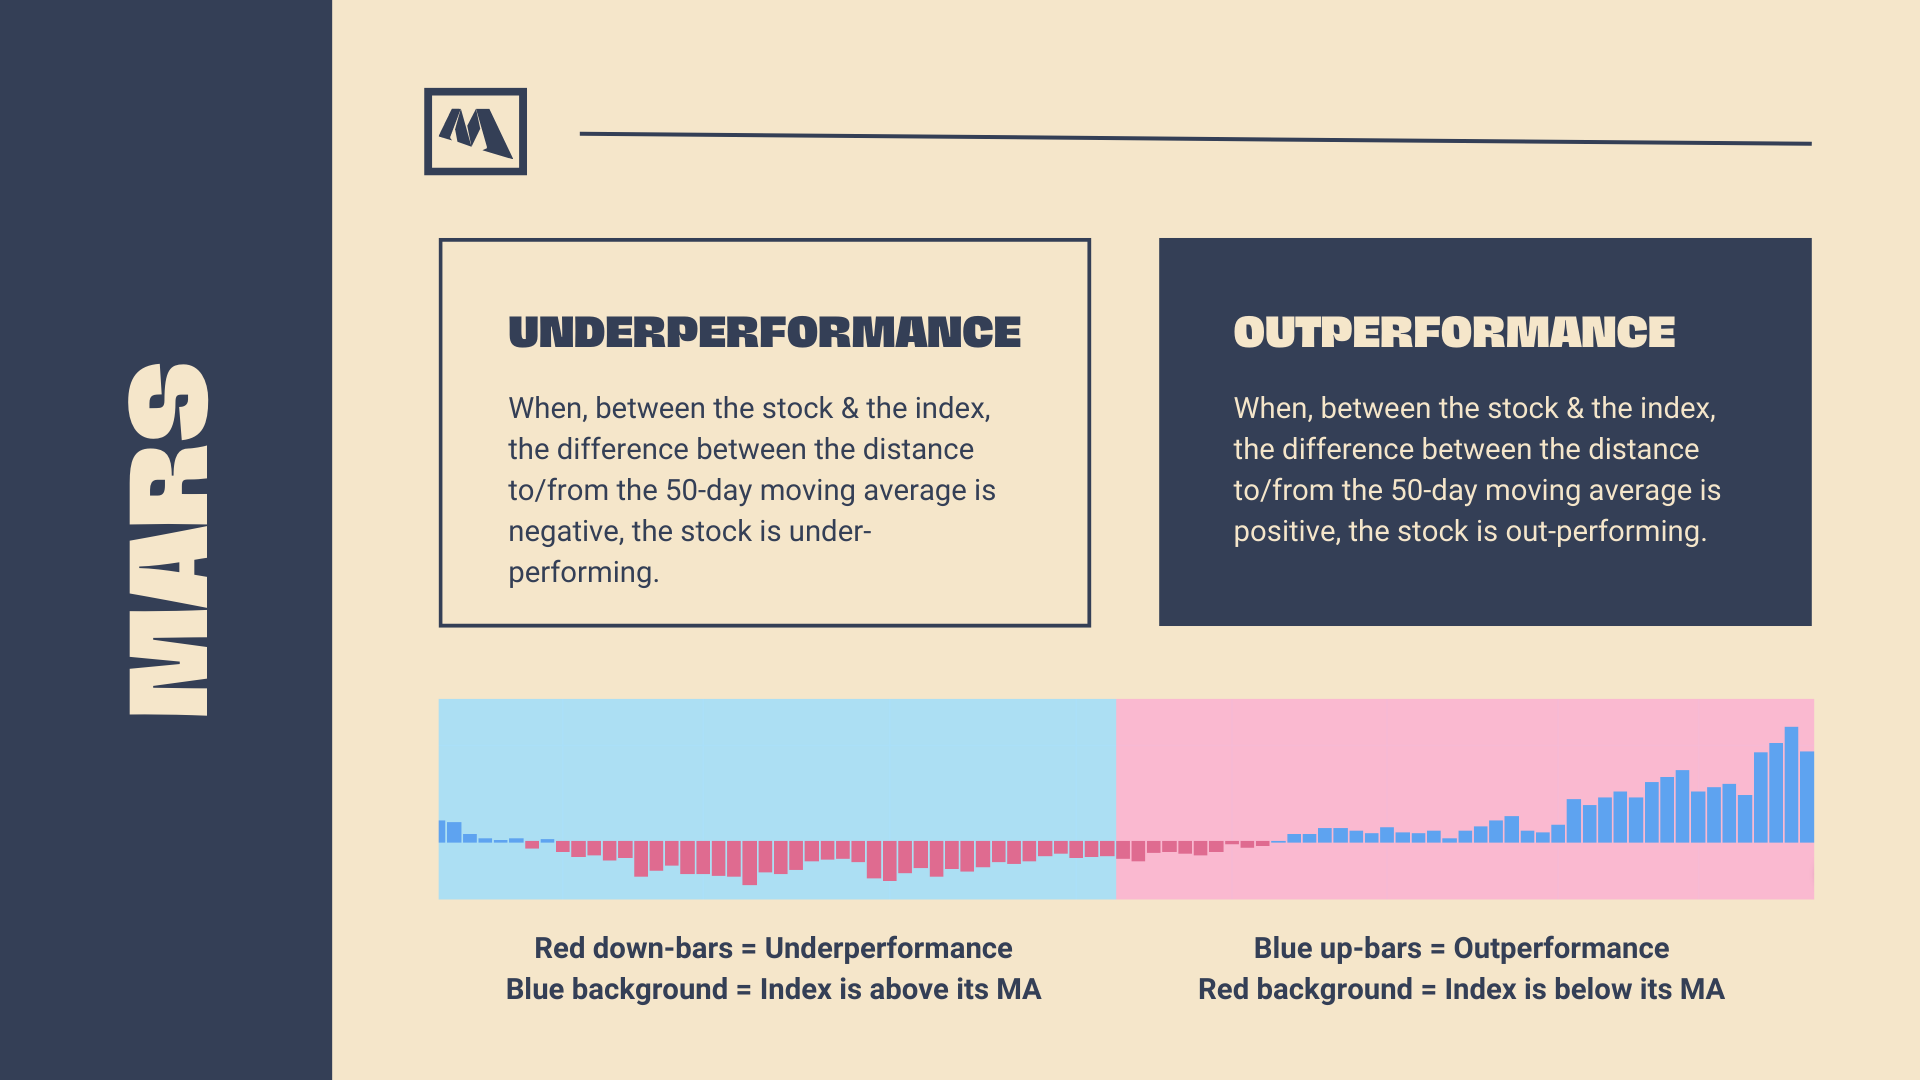
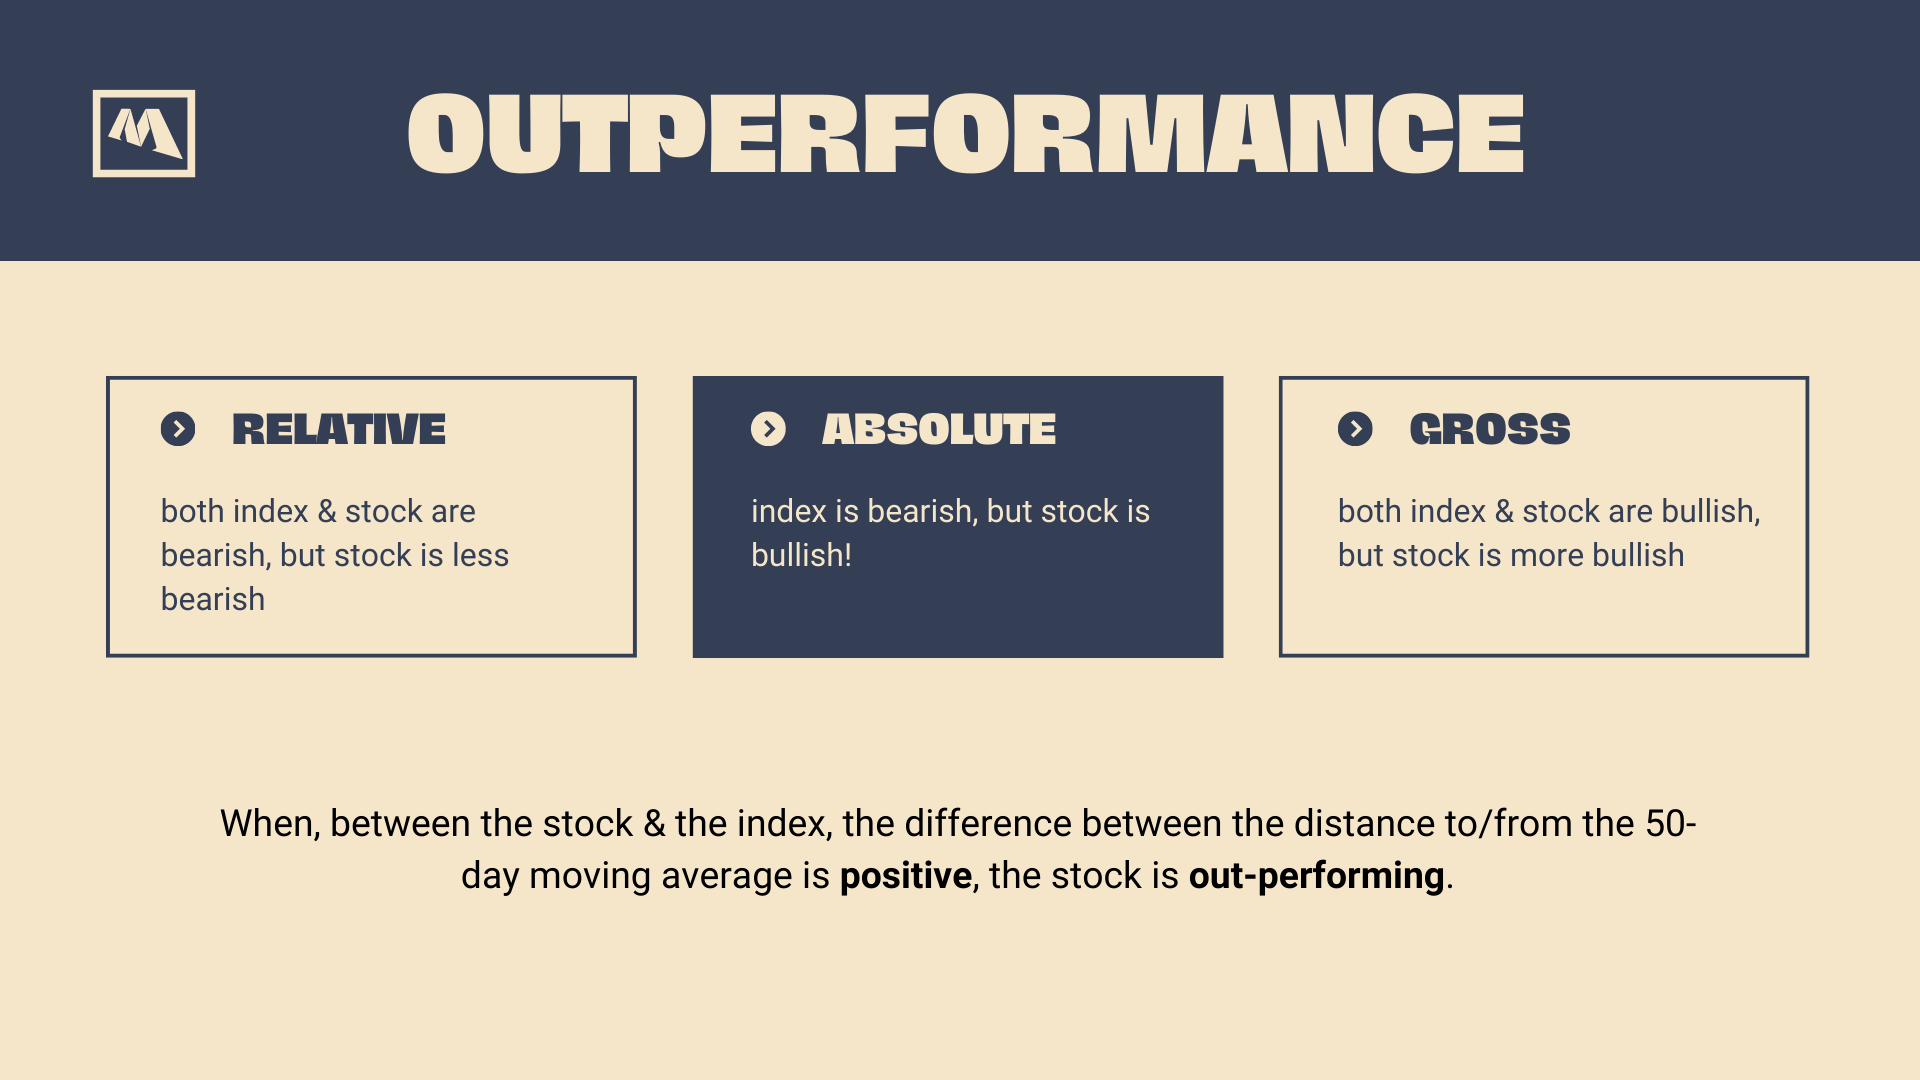
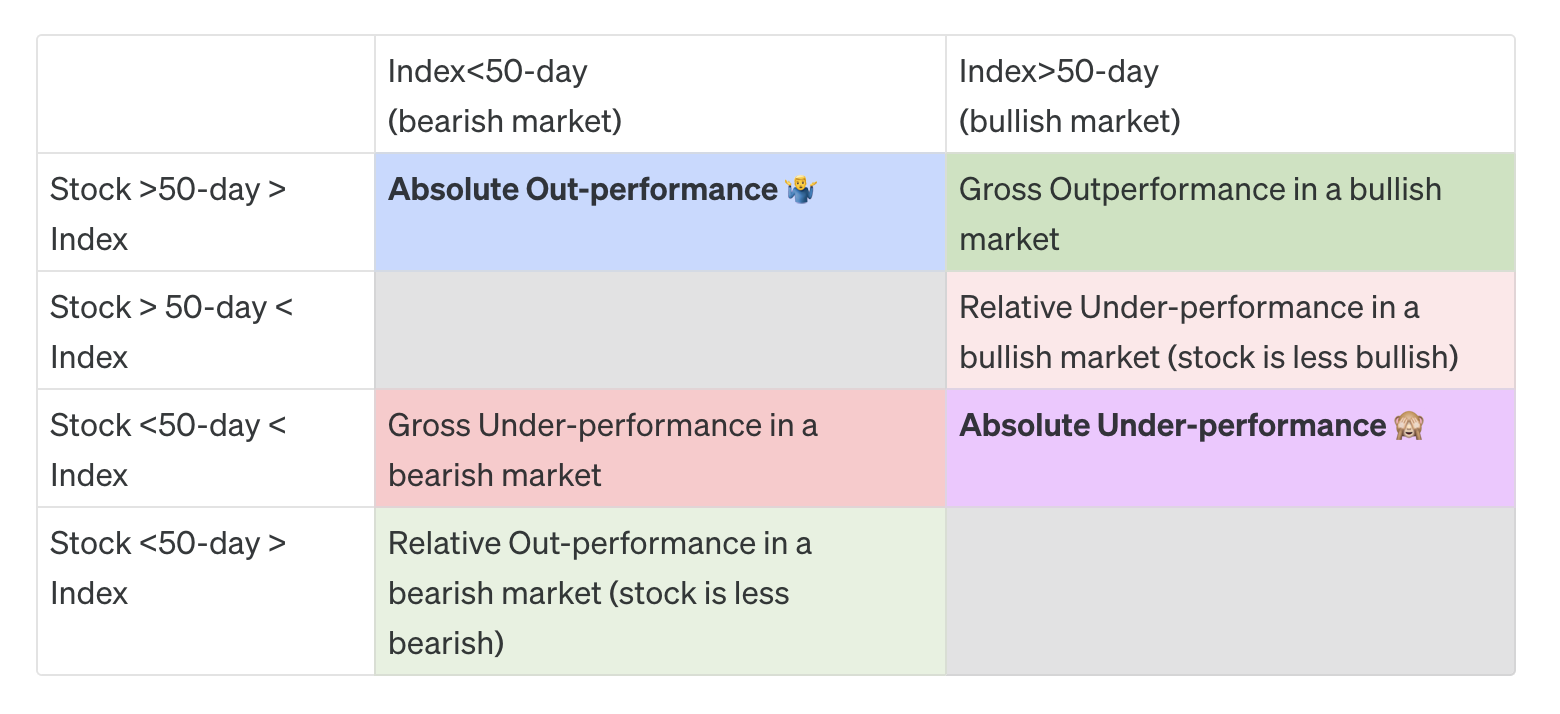
When, between the stock & the index, the difference between the distance to/from the 50-day moving average is positive, the stock is out-performing.
This outperformance can be of 3 types: ⦿ Relative ⦿ Absolute ⦿ Gross
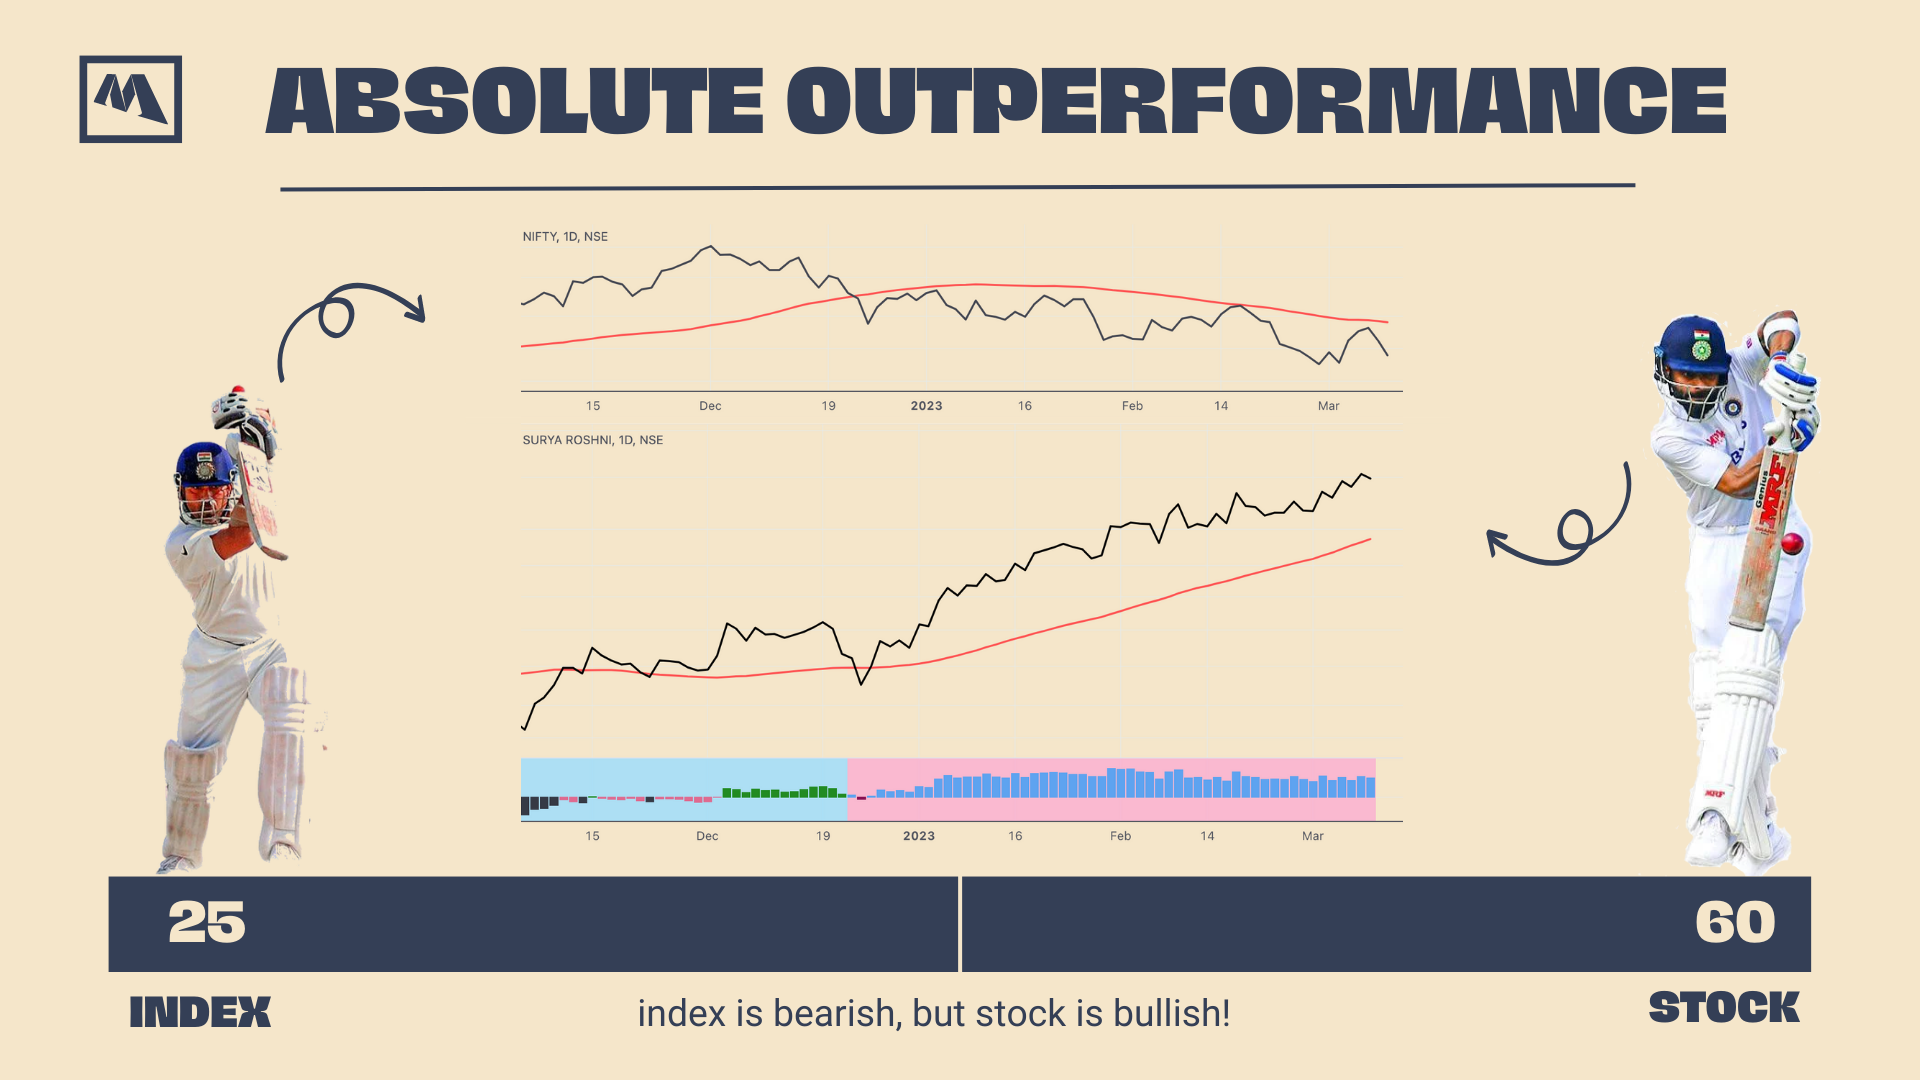
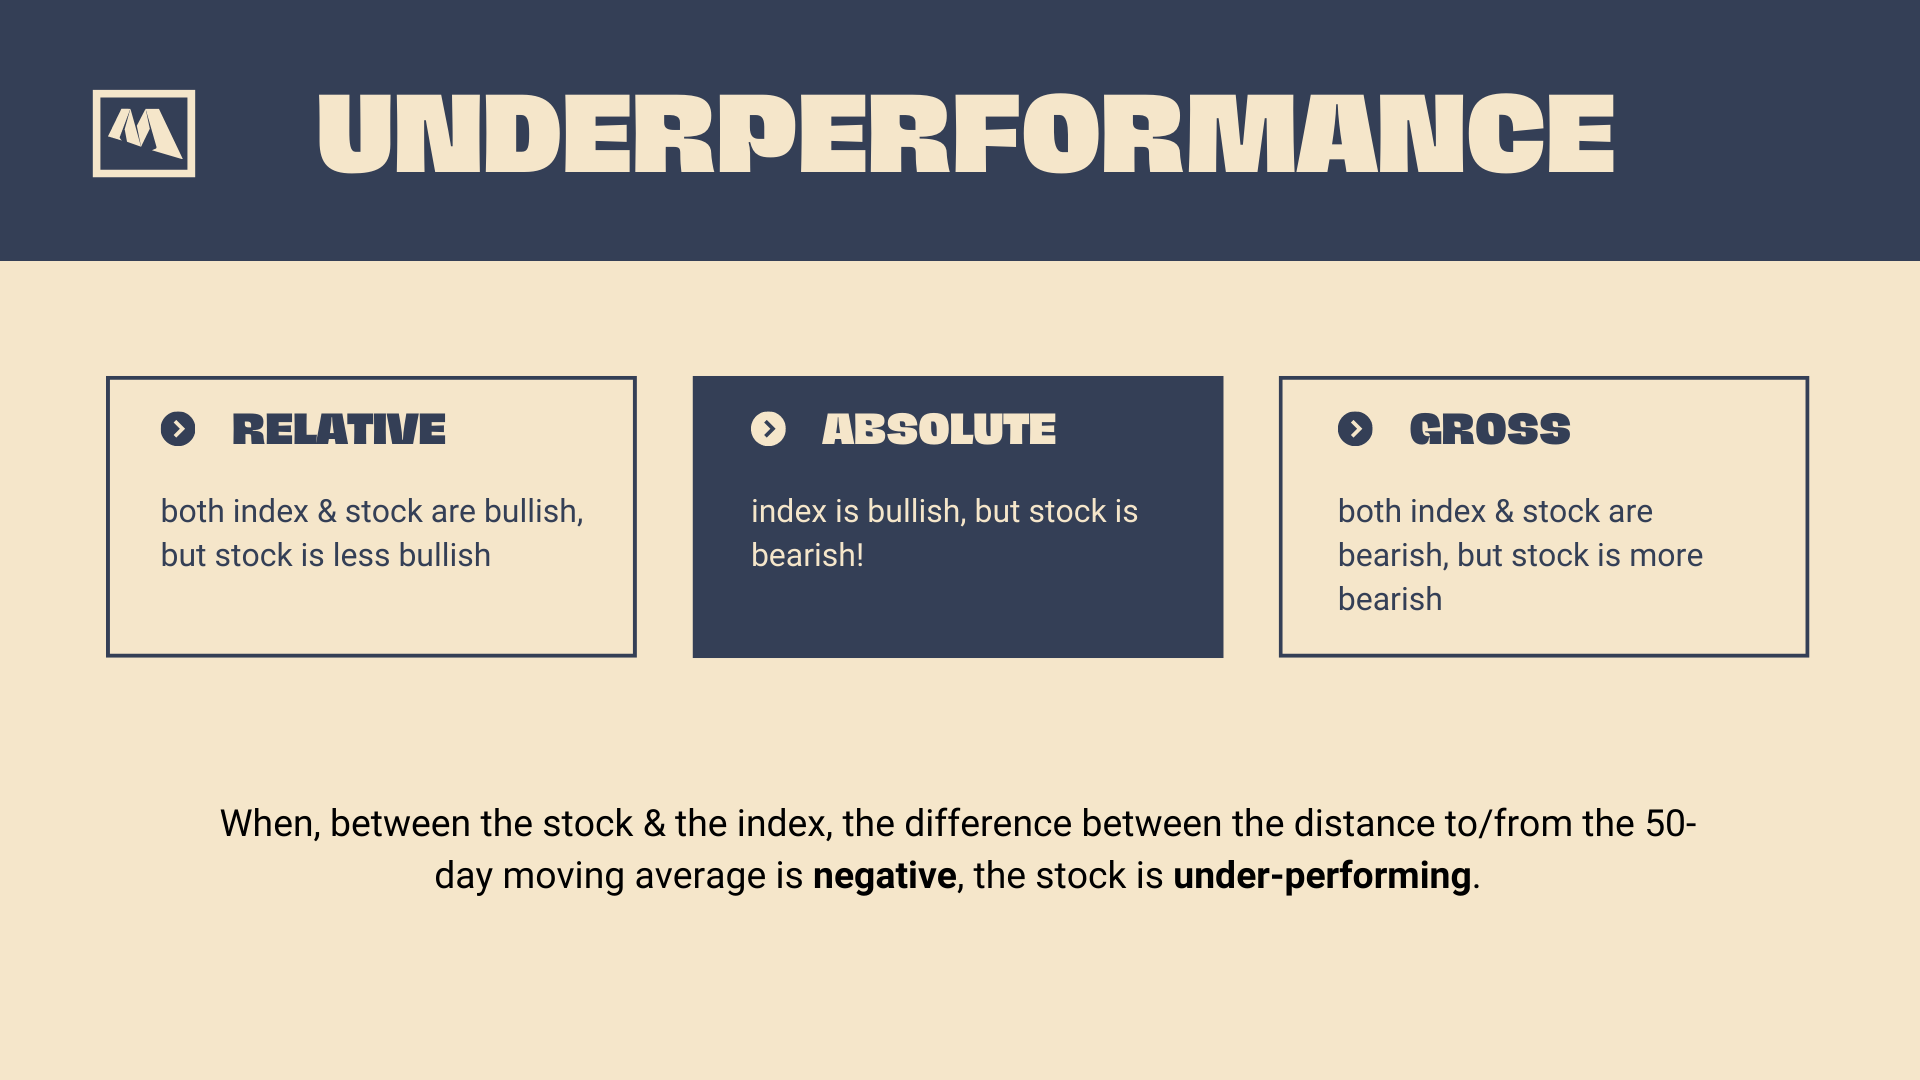
Absolute Outperformance
⦿ Batting conditions are tough. Sachin has made just 25 runs (bearish), but Kohli has easily made 60 runs (bullish). ⦿ The index is bearish, but the stock is bullish. ⦿ The script prints blue up-bars on a pink background.
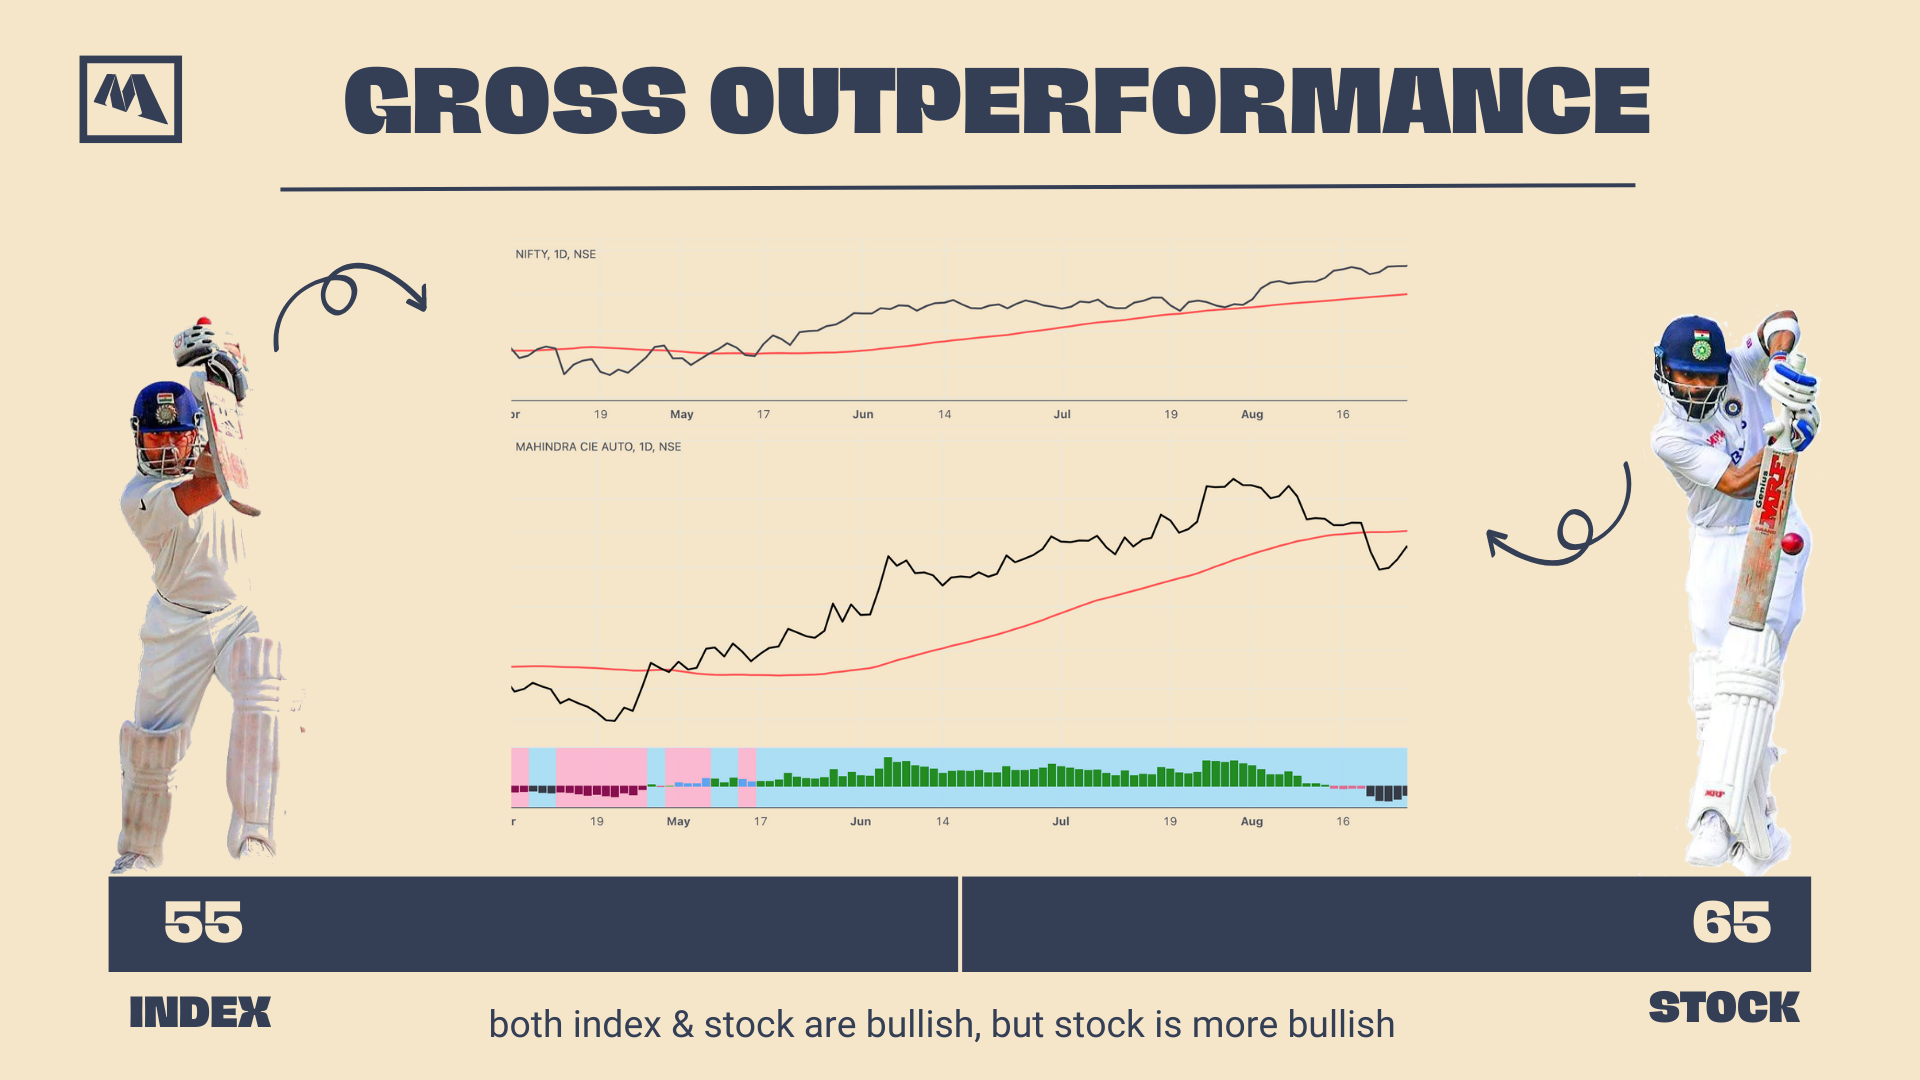
Gross Outperformance
⦿ Batting conditions are easy. Sachin has made 55 runs (bullish), but Kohli has made 65 runs (bullish). ⦿ Both index & stock are bullish, but stock is more bullish ⦿ The script prints green up-bars on a blue background.
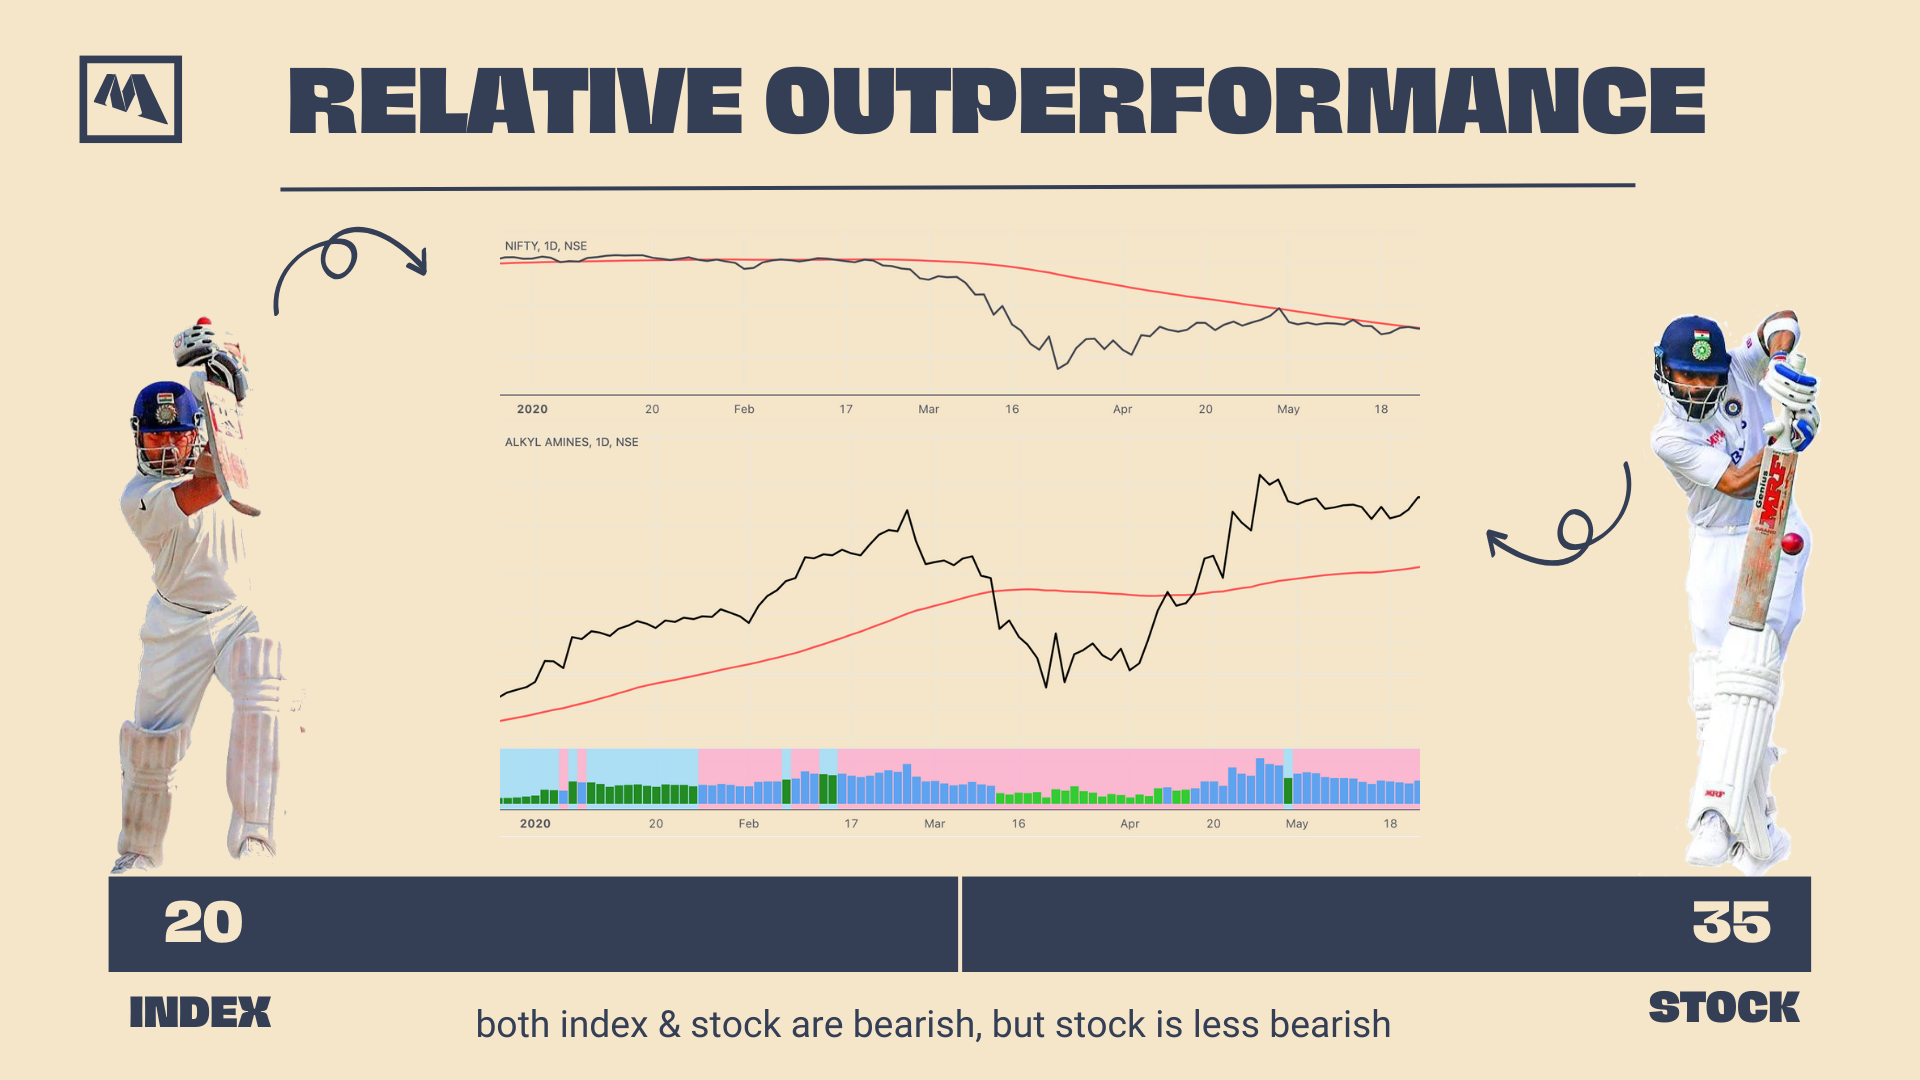
Relative Outperformance
⦿ Batting conditions are tough. Sachin has made 20 runs (bearish), but Kohli has made 35 runs (less bearish). ⦿ Both index & stock are bearish, but stock is less bearish ⦿ The script prints light green up-bars on a pink background.
Underperformance
When, between the stock & the index, the difference between the distance to/from the 50-day moving average is negative, the stock is under-performing.
This underperformance can be of 3 types: ⦿ Relative ⦿ Absolute ⦿ Gross
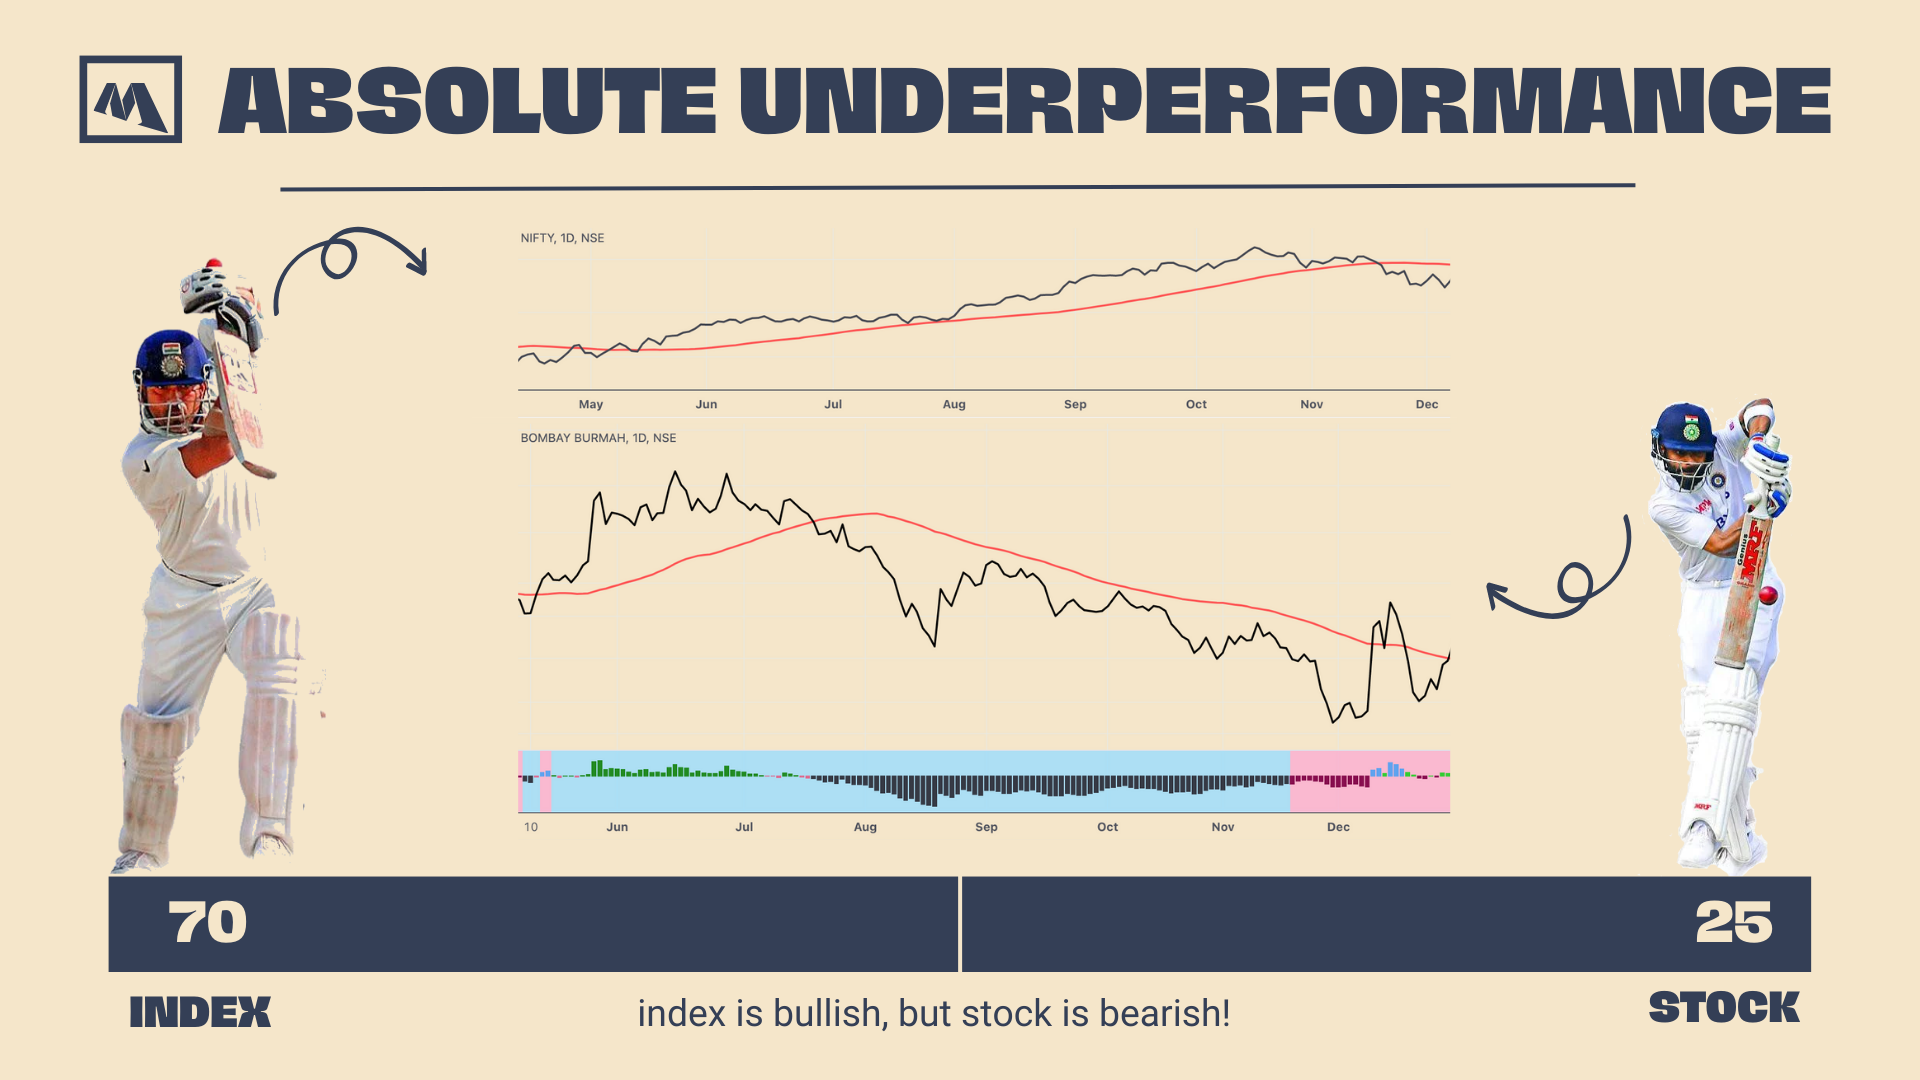
Absolute Underperformance
⦿ Batting conditions are easy. Sachin has already made 70 runs (bullish), but Kohli has only made 25 runs (bearish). ⦿ The index is bullish, but the stock is bearish. ⦿ The script prints black down-bars on a blue background.
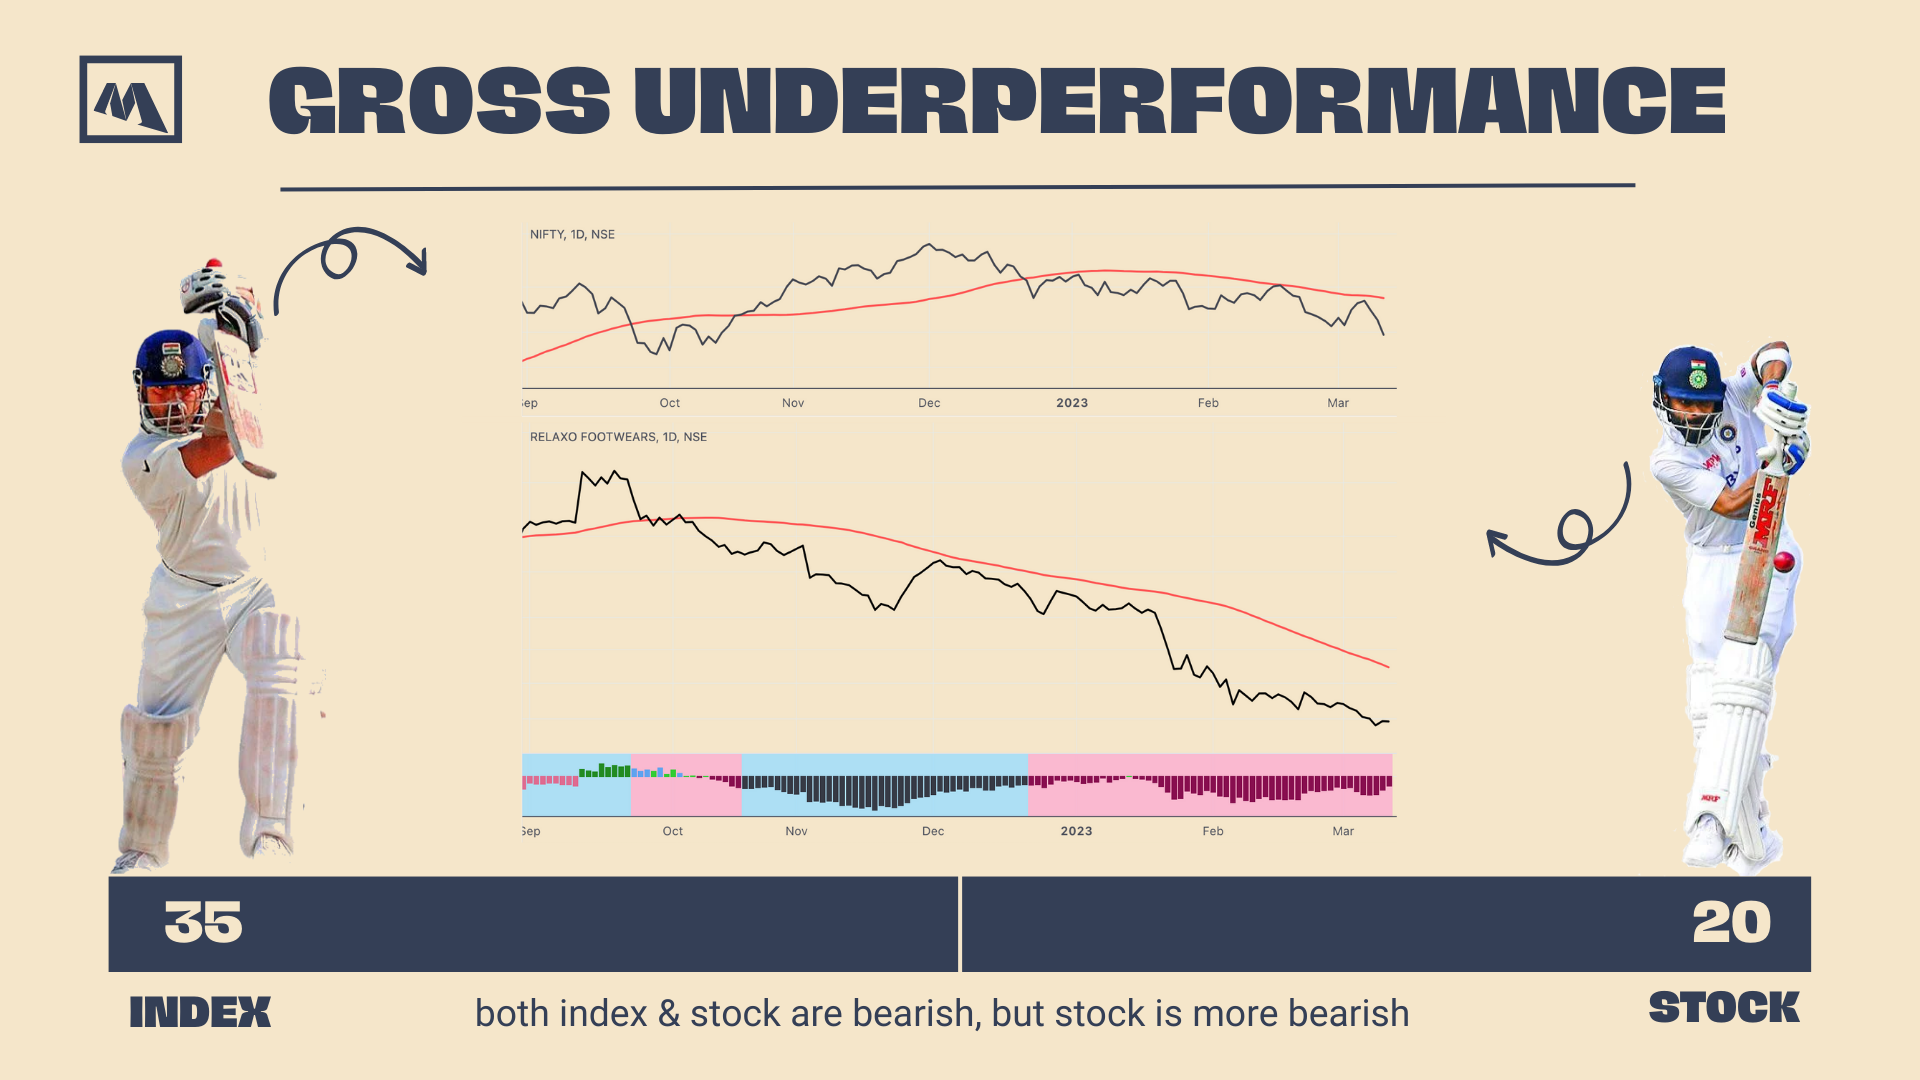
Gross Underperformance
⦿ Batting conditions are tough. Sachin has made 35 runs (bearish), but Kohli has made only 20 runs (more bearish). ⦿ Both index & stock are bearish, but stock is more bearish ⦿ The script prints dark red down-bars on a pink background.
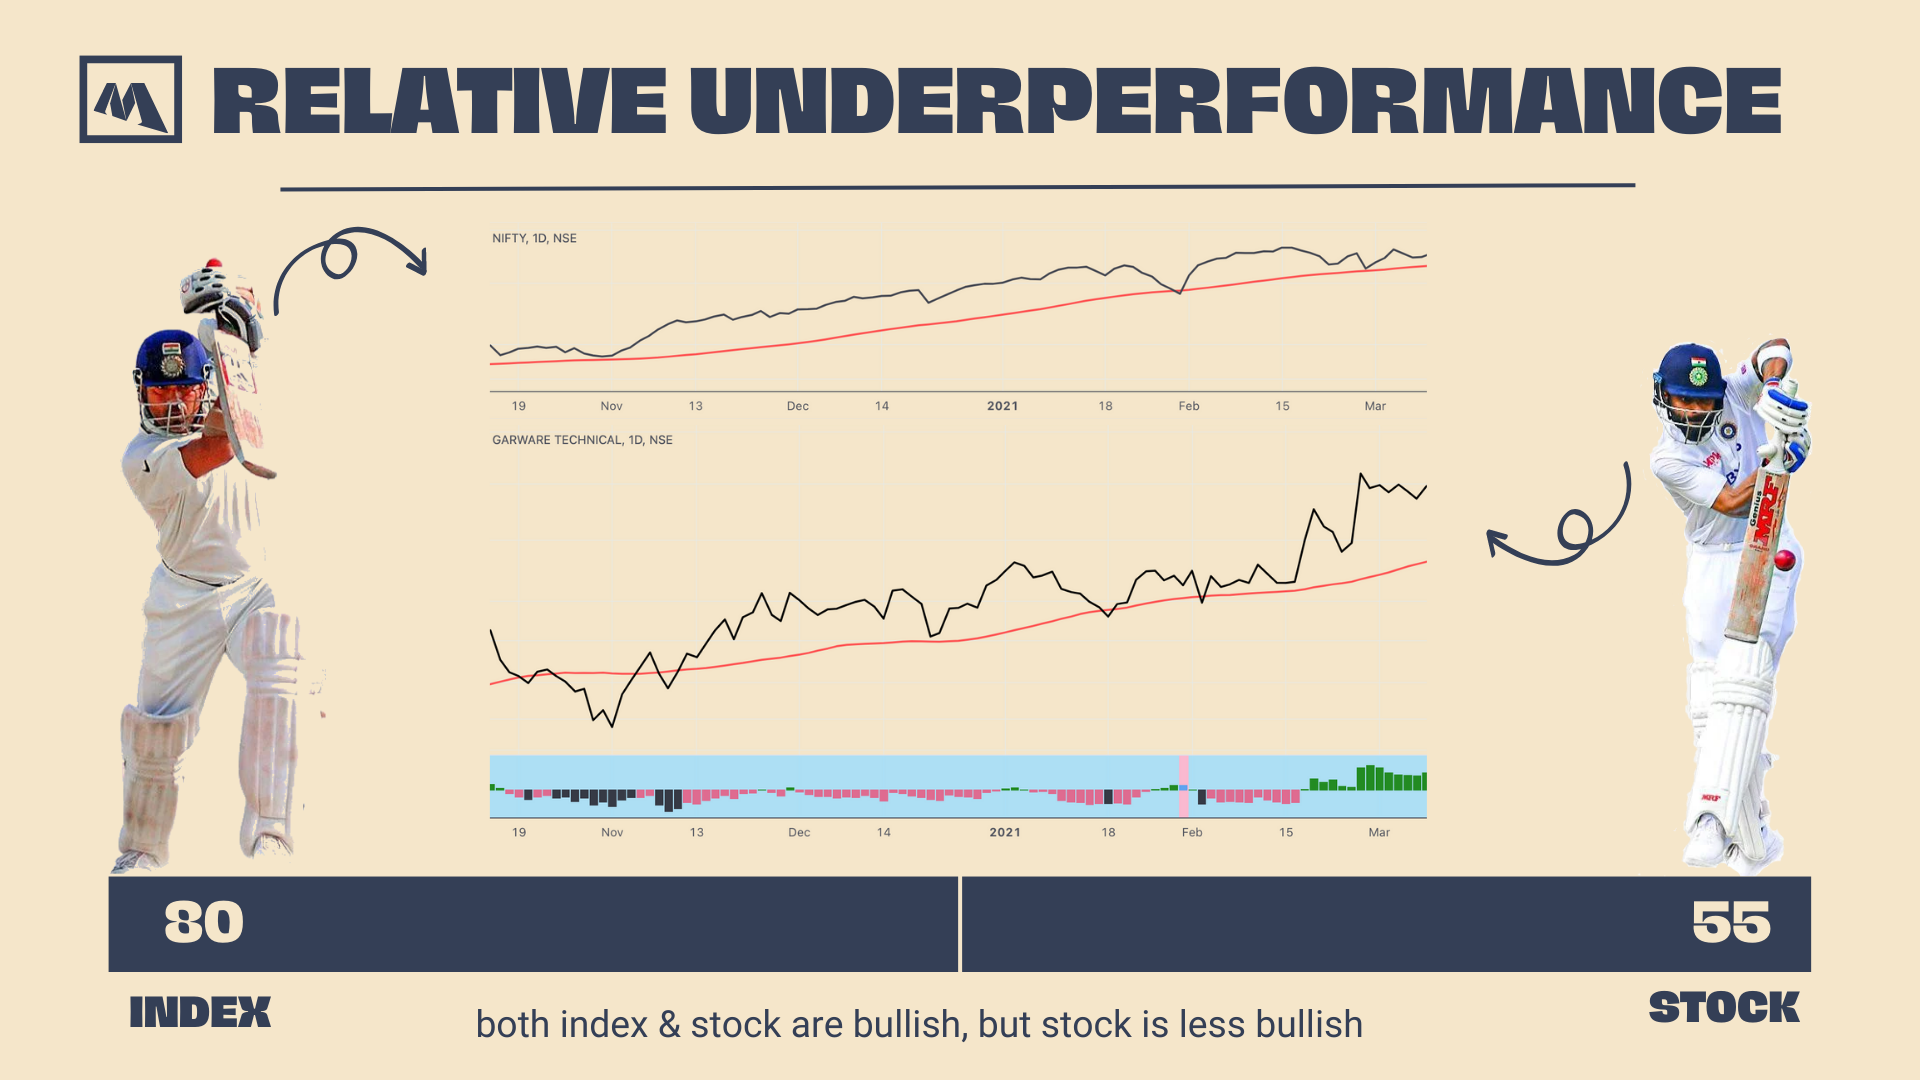
Relative Underperformance
⦿ Batting conditions are easy. Sachin has made 80 runs (bullish), but Kohli has made 55 runs (less bullish). ⦿ Both index & stock are bullish, but stock is less bullish ⦿ The script prints light red down-bars on a blue background.
Additional customisation options:
Paint bars option changes the bar colors to mirror the histogram colors.
Easy colors option just changes the histogram colors to either blue or pink, indicating out-performance or under-performance, respectively. This is when the trader does not wish to demarcate between the above-mentioned 6 conditions.
Conclusion
In a nutshell, we would love Absolute Outperformance, & totally stay away from Absolute Underperformance.
Hope you find this useful. If you'd wish to know when I publish something new, just subscribe to my newsletter and you'll get the latest sent direct to you. 🙂