Here is the Pivot High Low Duo script for Tradingview.
This is just an extension of the built-in Pivot Points High Low script.
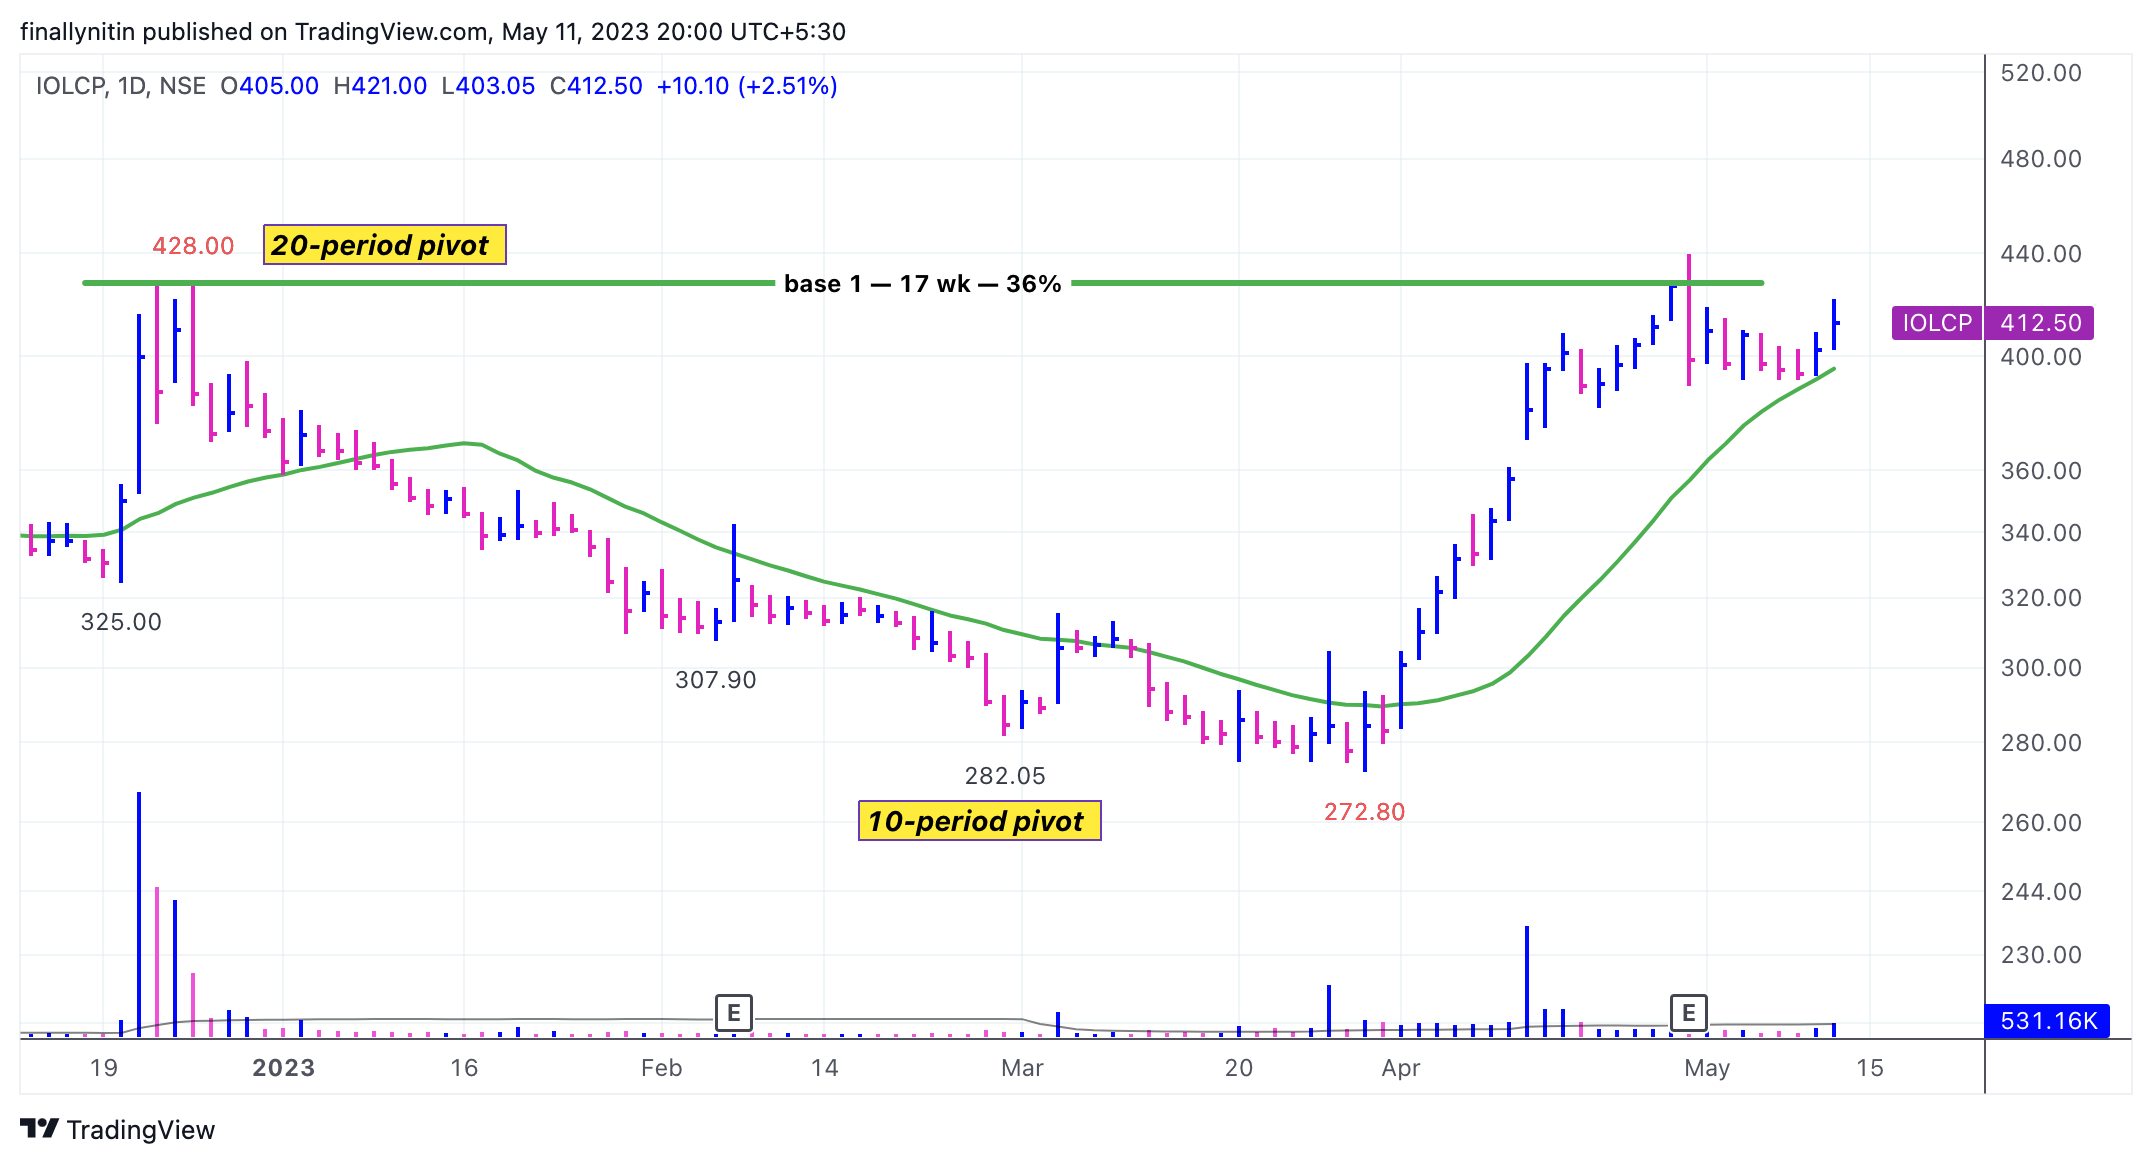
Here it plots both 10-period & 20-period pivots in one script. All 20-period pivots will be 10-period pivots, so it avoids some clutter. Additionally, there is an option to show only the 10-period, or the 20-period pivots.
The basic concept is that if the high (or the low) is not crossed for next 20 bars, then the 20-period (or the 10-period) pivot high (or low) is formed.
This is just an extension of the built-in Pivot Points High Low script.
Here it plots both 10-period & 20-period pivots in one script. All 20-period pivots will be 10-period pivots, so it avoids some clutter. Additionally, there is an option to show only the 10-period, or the 20-period pivots.
The basic concept is that if the high (or the low) is not crossed for next 20 bars, then the 20-period (or the 10-period) pivot high (or low) is formed.
I found these helpful in determining major price points, swing highs, & drawing horizontal lines for base counting.
For people following Elliot waves, Pivot high & lows can also help one can label wave counts easily. Himanshu bhai has done a wonderful video on this:
Since this is just a re-hash of the built-in Pivot Points High Low script, it is not an original work, & hence cannot be published on Tradingview. Here is the source code for the script. Just copy the entire code as-is, go to Pine Editor, delete everything you see there, paste this script, save & add to chart.
That’s all for this quick post. If you'd like to know when I publish something new, just subscribe to my newsletter and you'll get the latest sent direct to you.