The daily price range is a good proxy to judge an instrument’s volatility. I have combined multiple concepts in this “Simple Range” indicator, to displays information regarding the daily price range & its volatility.
This is a post on how to make use of the Simple Range indicator on Tradingview.
A trading day's range is simply the difference between the high and the low. This script shows the daily high-to-low range of the price as a column chart. It has 3 main components:
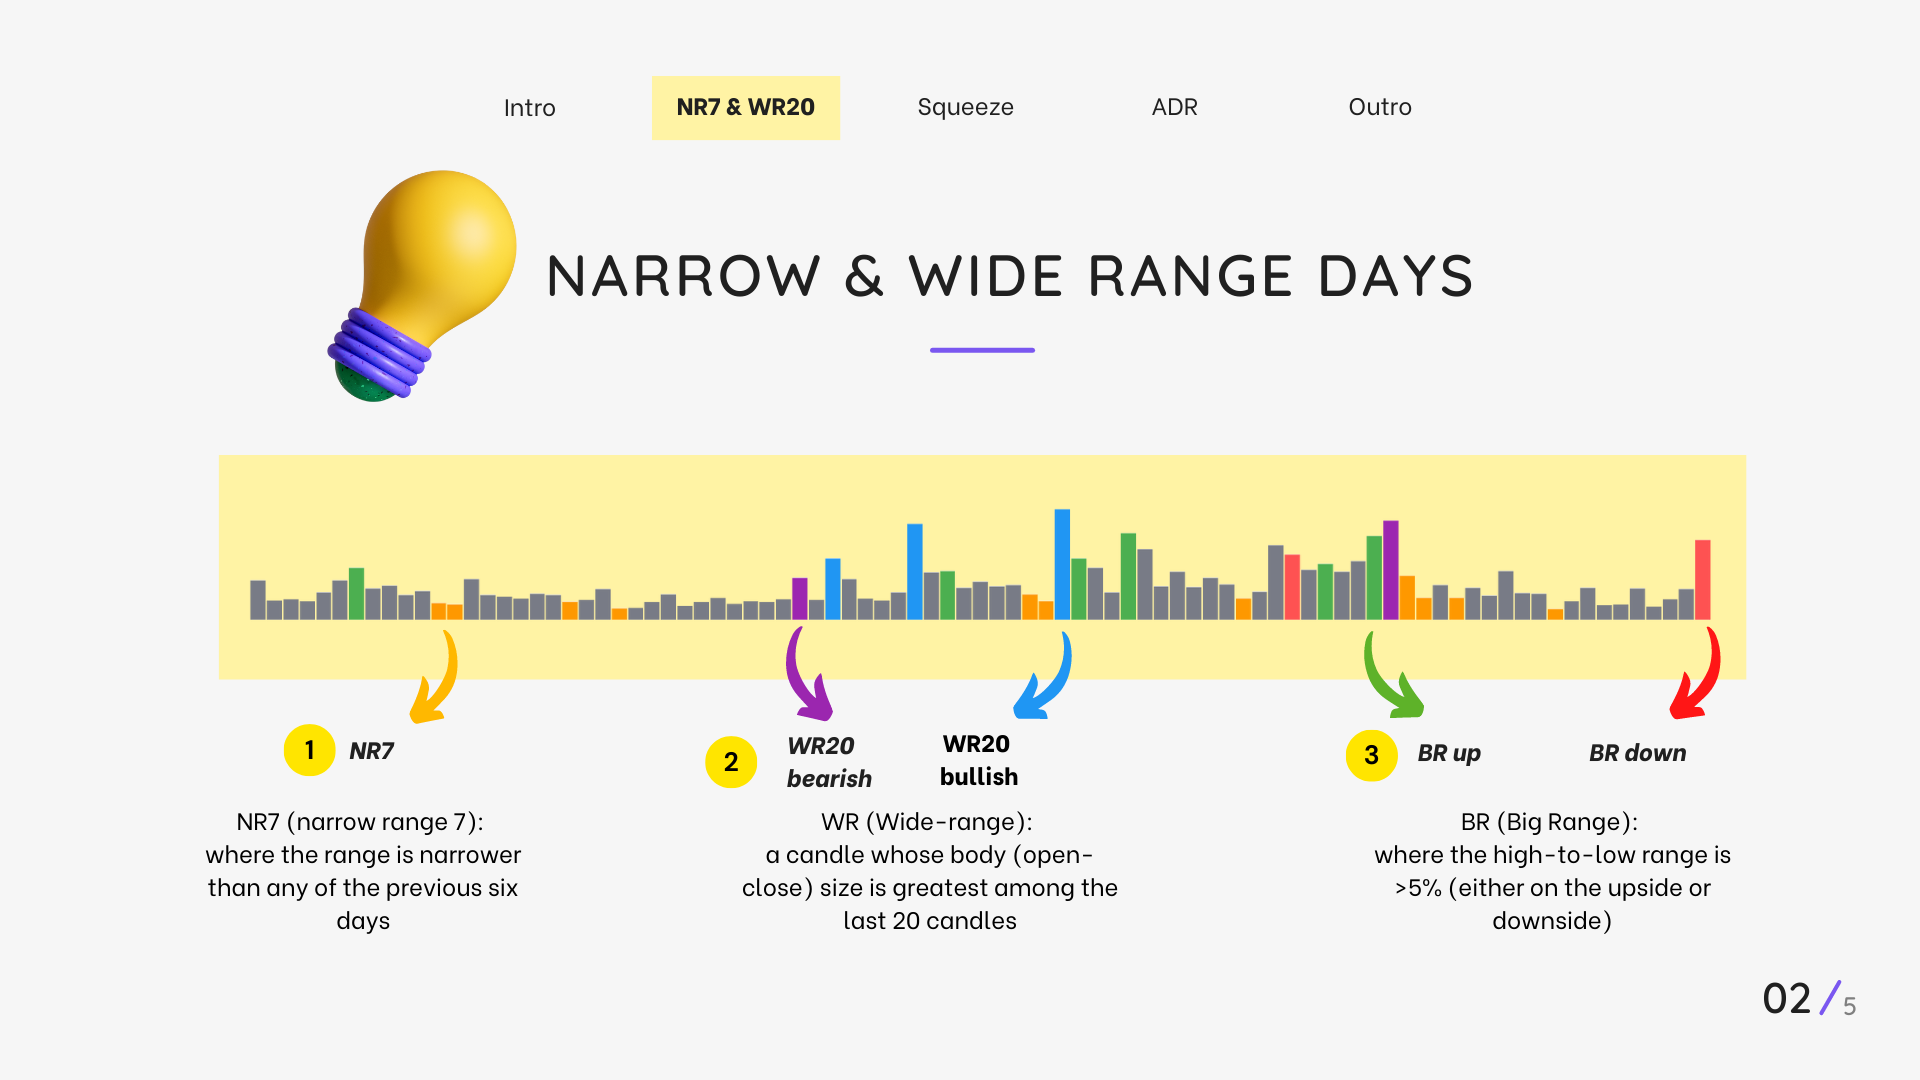
Narrow-range days (NR7) & Wide-range Days (WR20) - as plot columns
Original concept from Thomas Bulkowski
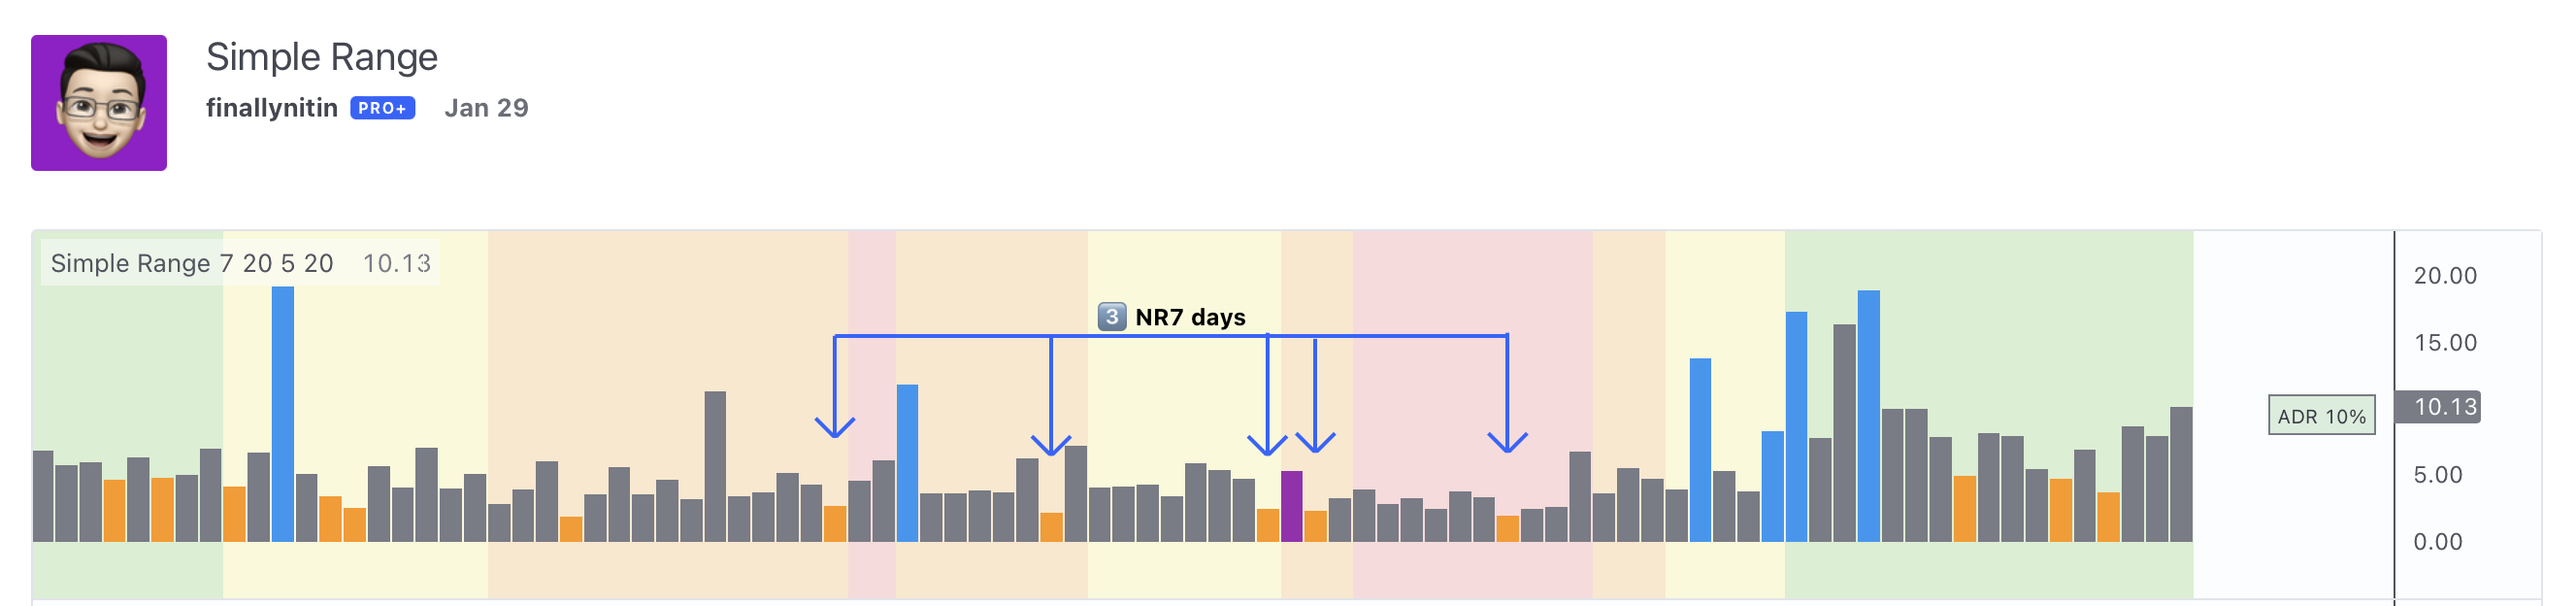
Narrow range days mark price contractions that often precede price expansions. This script uses NR7 (narrow range 7) as a narrow-range day. This value can be changed by the user if, instead of an NR7, he or she wishes to use NR4 or NR21, or any other interval of his or her choice. NR7 is an indecisive trading day in which the range is narrower than any of the previous six days (a total of 7 days). A breakout is said to occur when price closes above the top or below the bottom of the NR7. Upside breakout of an NR 7 candle with high volumes indicates bullishness.
Similarly, highs & lows of wide-range bars (on big volumes) are also significant reference levels for price. Wide-range candle are identified by size of the body candle (open - close). The script compares the size of previous 20 candles to identify WR20 candles. WR20 (Wide-range) is a candle whose body (open-close) size is greatest among the last 20 candles. This value can also be changed by the user.
The script shows NR7 & WR20 as orange & blue bars, respectively.
The user can also turn on the option to identify a big high-to-low range candle greater than a pre-defined threshold (default is 5%). These show up as green or red bars.
TTM Squeeze - as background
Original concept from John Carter's book "Mastering the Trade"
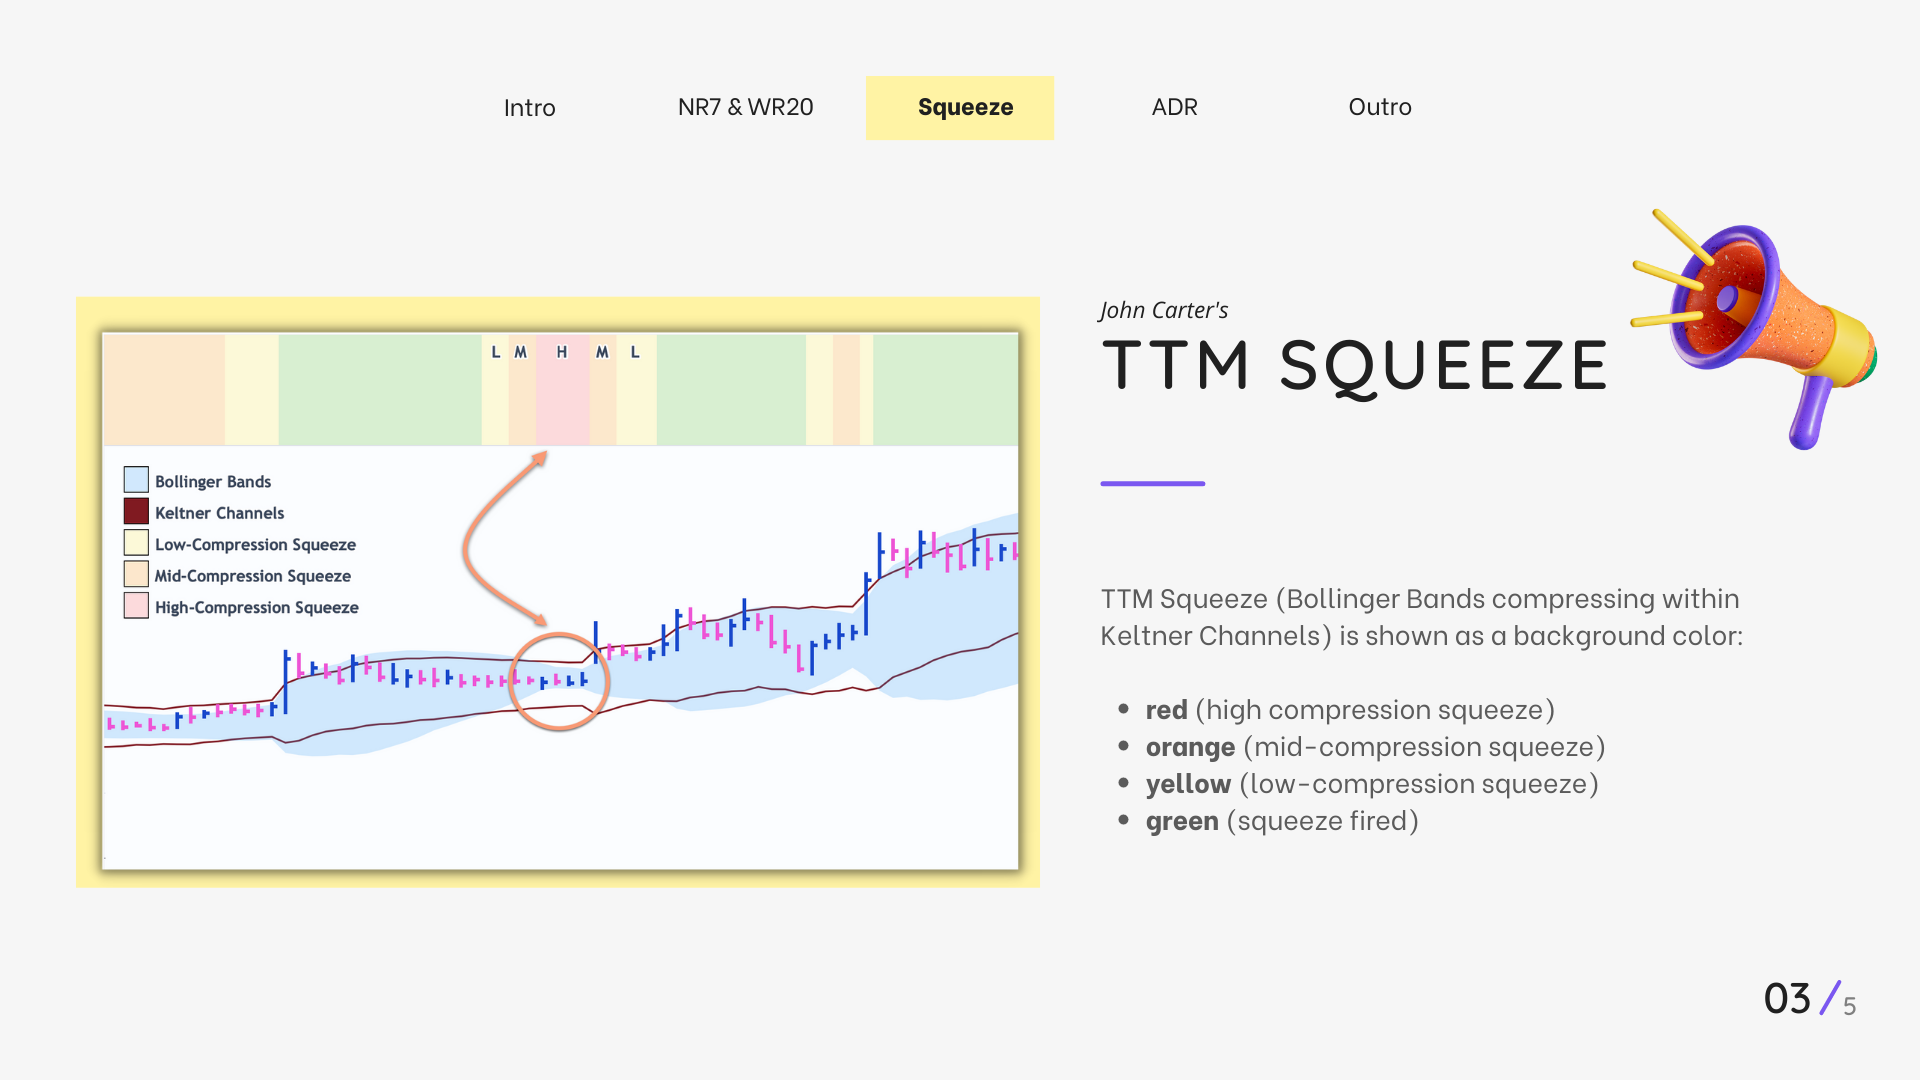
John Carter’s TTM Squeeze indicator looks at the relationship between Bollinger Bands and Keltner's Channels to help identify period of volatility contractions. Bollinger Bands being completely enclosed within the Keltner Channels is indicative of a very low volatility . This is a state of volatility contraction known as squeeze.
Using different ATR lengths (1.0, 1.5 and 2.0) for Keltner Channels , we can differentiate between levels of squeeze (High, Mid & Low compression, respectively). Greater the compression, higher the potential for explosive moves.
In the script, the High, Mid & Low compression squeezes are depicted via the background color being red, orange , or yellow, respectively.
Average Daily Range % - as table
Original concept by alpine_trader
Average Day Range (ADR) tells how much the price moves between the high and low on a given day. This is the day Range, which is then averaged to create ADR. The script uses an average of the last 20 days to calculate the ADR. Unlike ATR ( Average True Range ), this excludes Gaps.
The script displays the ADR as a % value in a table.
If you want to find stocks that move a lot on an average on most days, then look for stocks that have ADR% of 5% or more. If you prefer lower volatility stocks, focus on stocks with lower ADR% values, such as 2% or less.
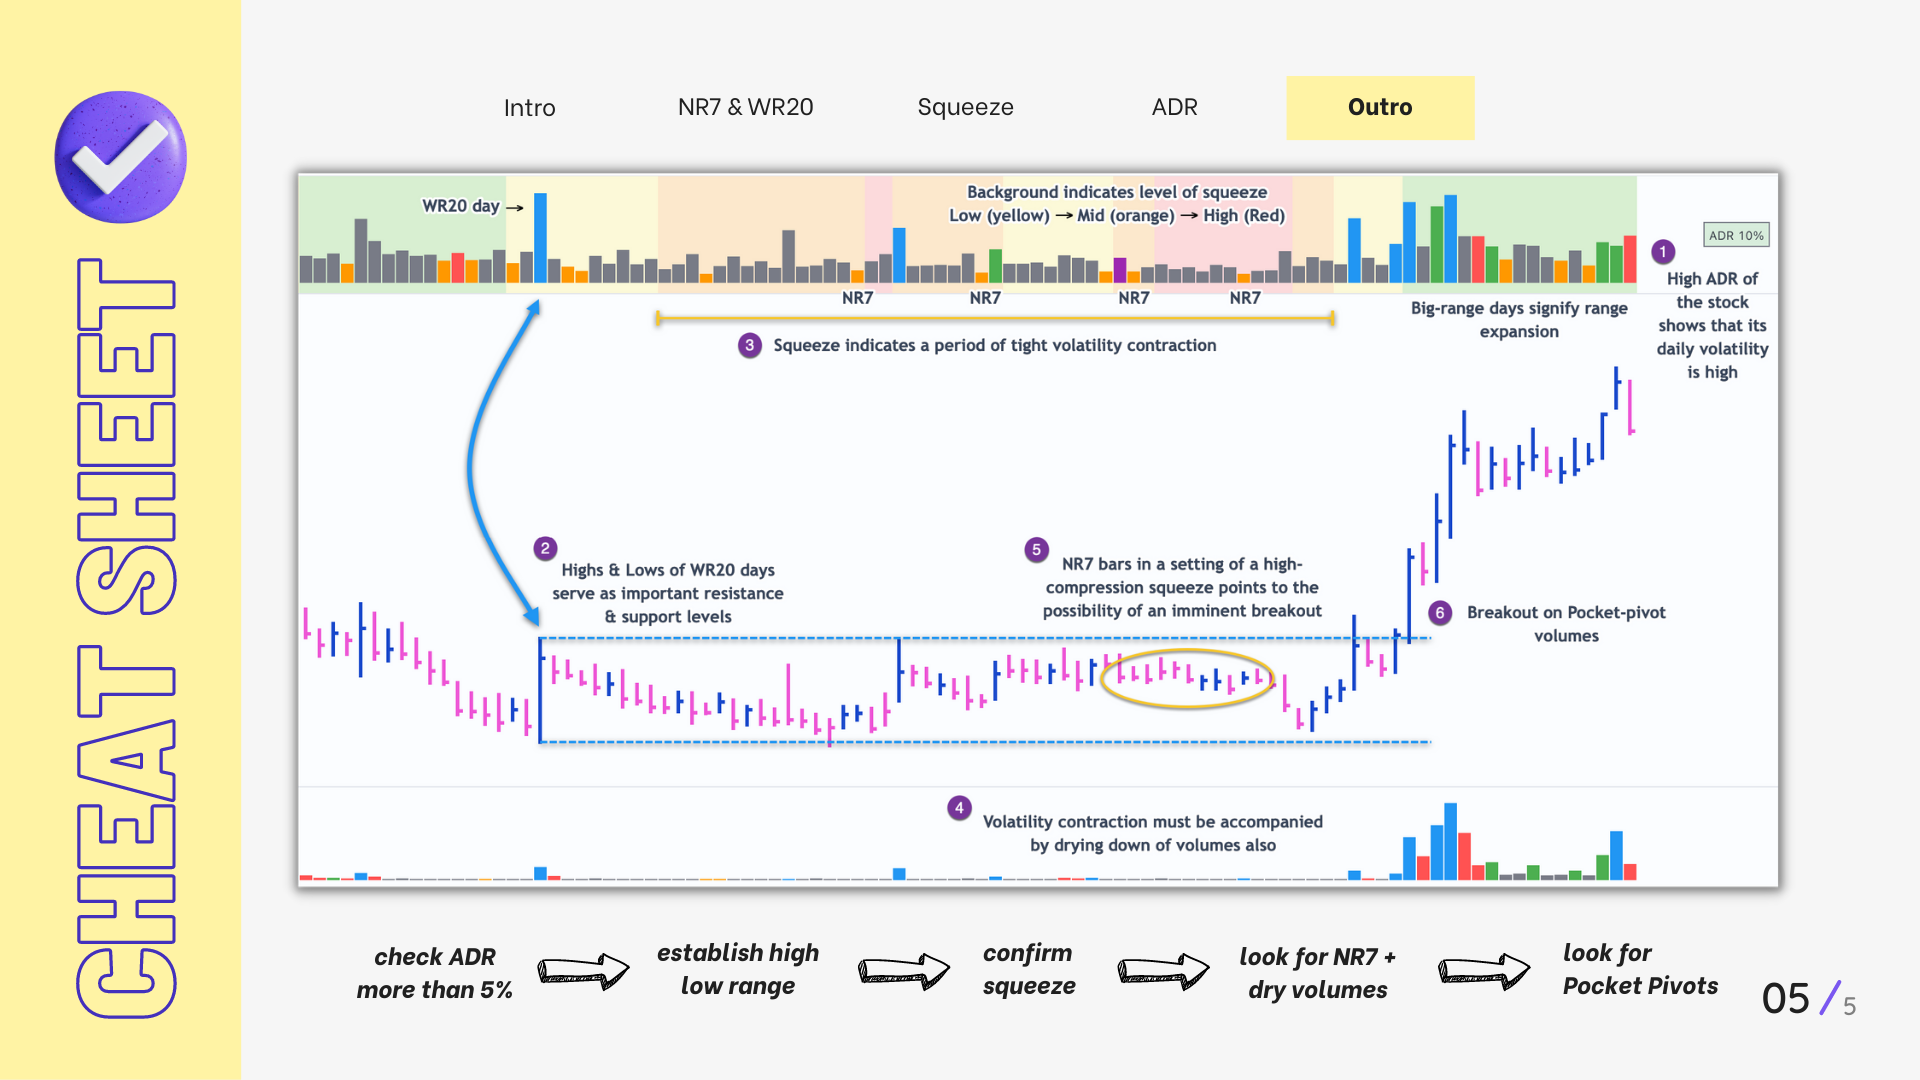
How it comes together
For a bullish "momentum burst", or a velocity trade:
Select stocks with Average Day Range % (ADR) greater than 5
Identify significant reference price levels via highs & lows of WR20 bars (on big volumes)
Wait for a decent mid-to-high compression squeeze
Look for clusters of NR7 candles in the consolidation
Any breakout from this consolidation should be accompanied by more than average (preferably pocket pivot) volumes
All the links
Here is the link for the Tradingview script: Simple Range
Here is the source code for the Simple Range script. In case the script ever gets taken down from Tradingview, just copy the entire source code as-is, go to Pine Editor in your Tradingview, delete everything you see there, paste this script, save & add to chart.
Hope you find this useful. If you'd wish to know when I publish something new, just subscribe to my newsletter and you'll get the latest sent direct to you. 🙂


.png)
.png?disposition=attachment)