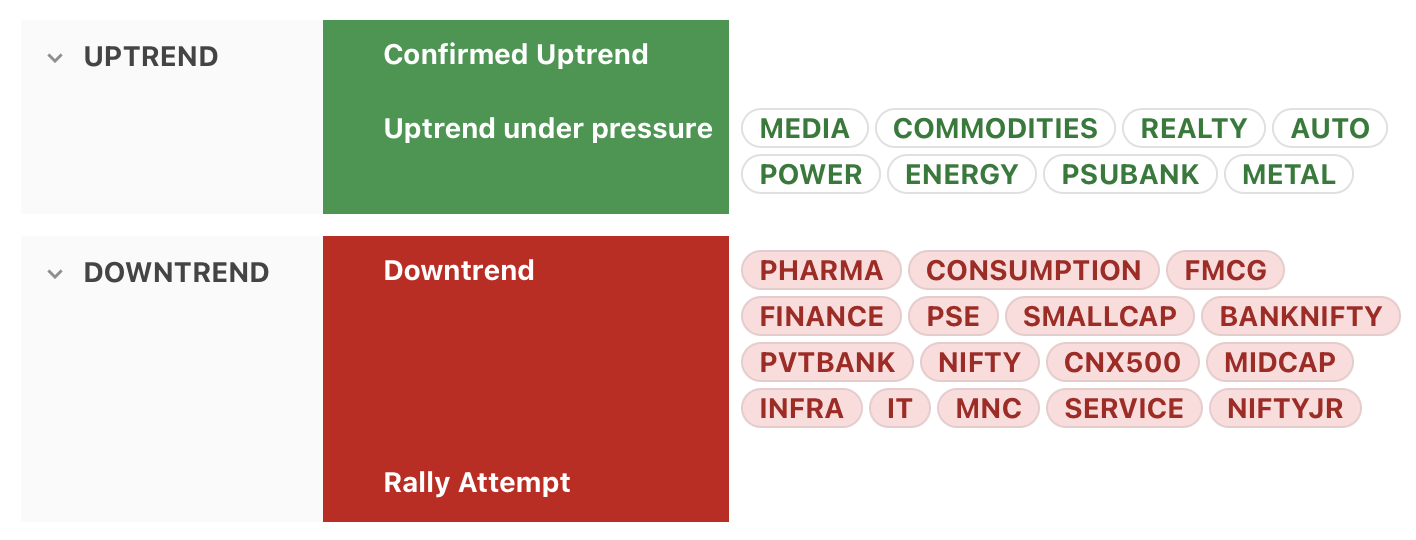
⦿ Most major indices (including Nifty, CNX500, Midcap, Smallcap) are in downtrend.
⦿ Auto, Metals & PSUbank are in uptrend under pressure.
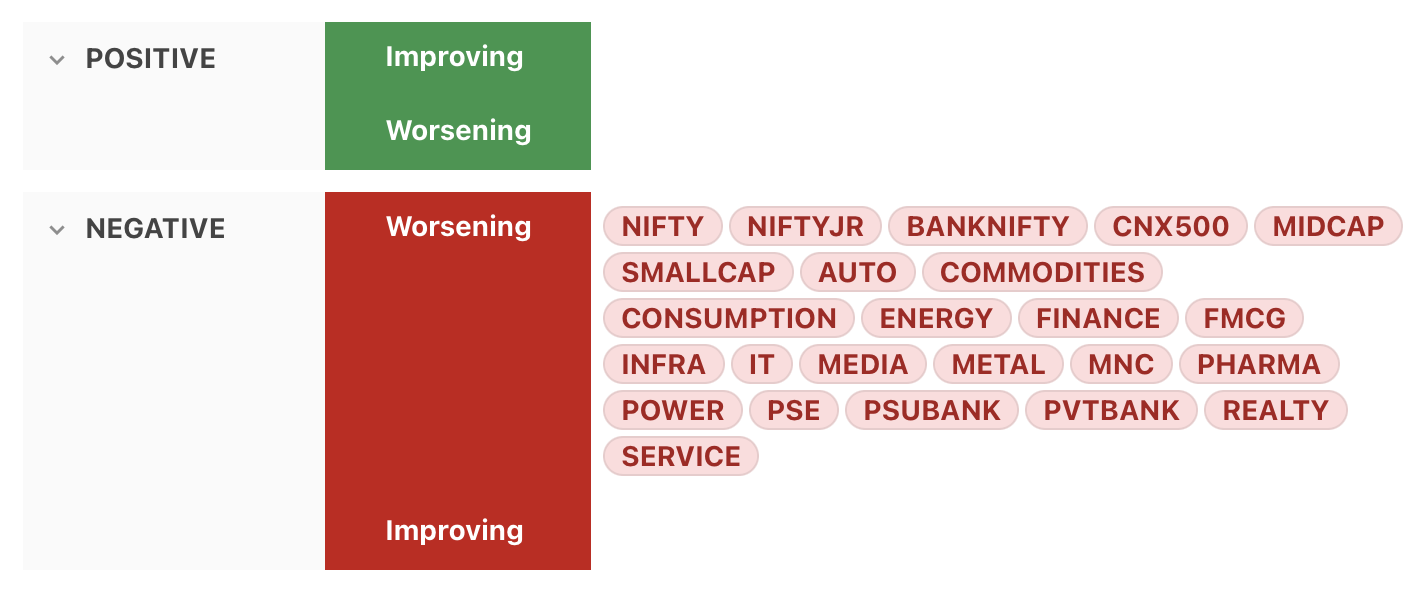
Momentum
⦿ No index is having positive momentum
⦿ All indices (including Nifty, CNX500, Midcap, Smallcap) are showing negative & worsening momentum
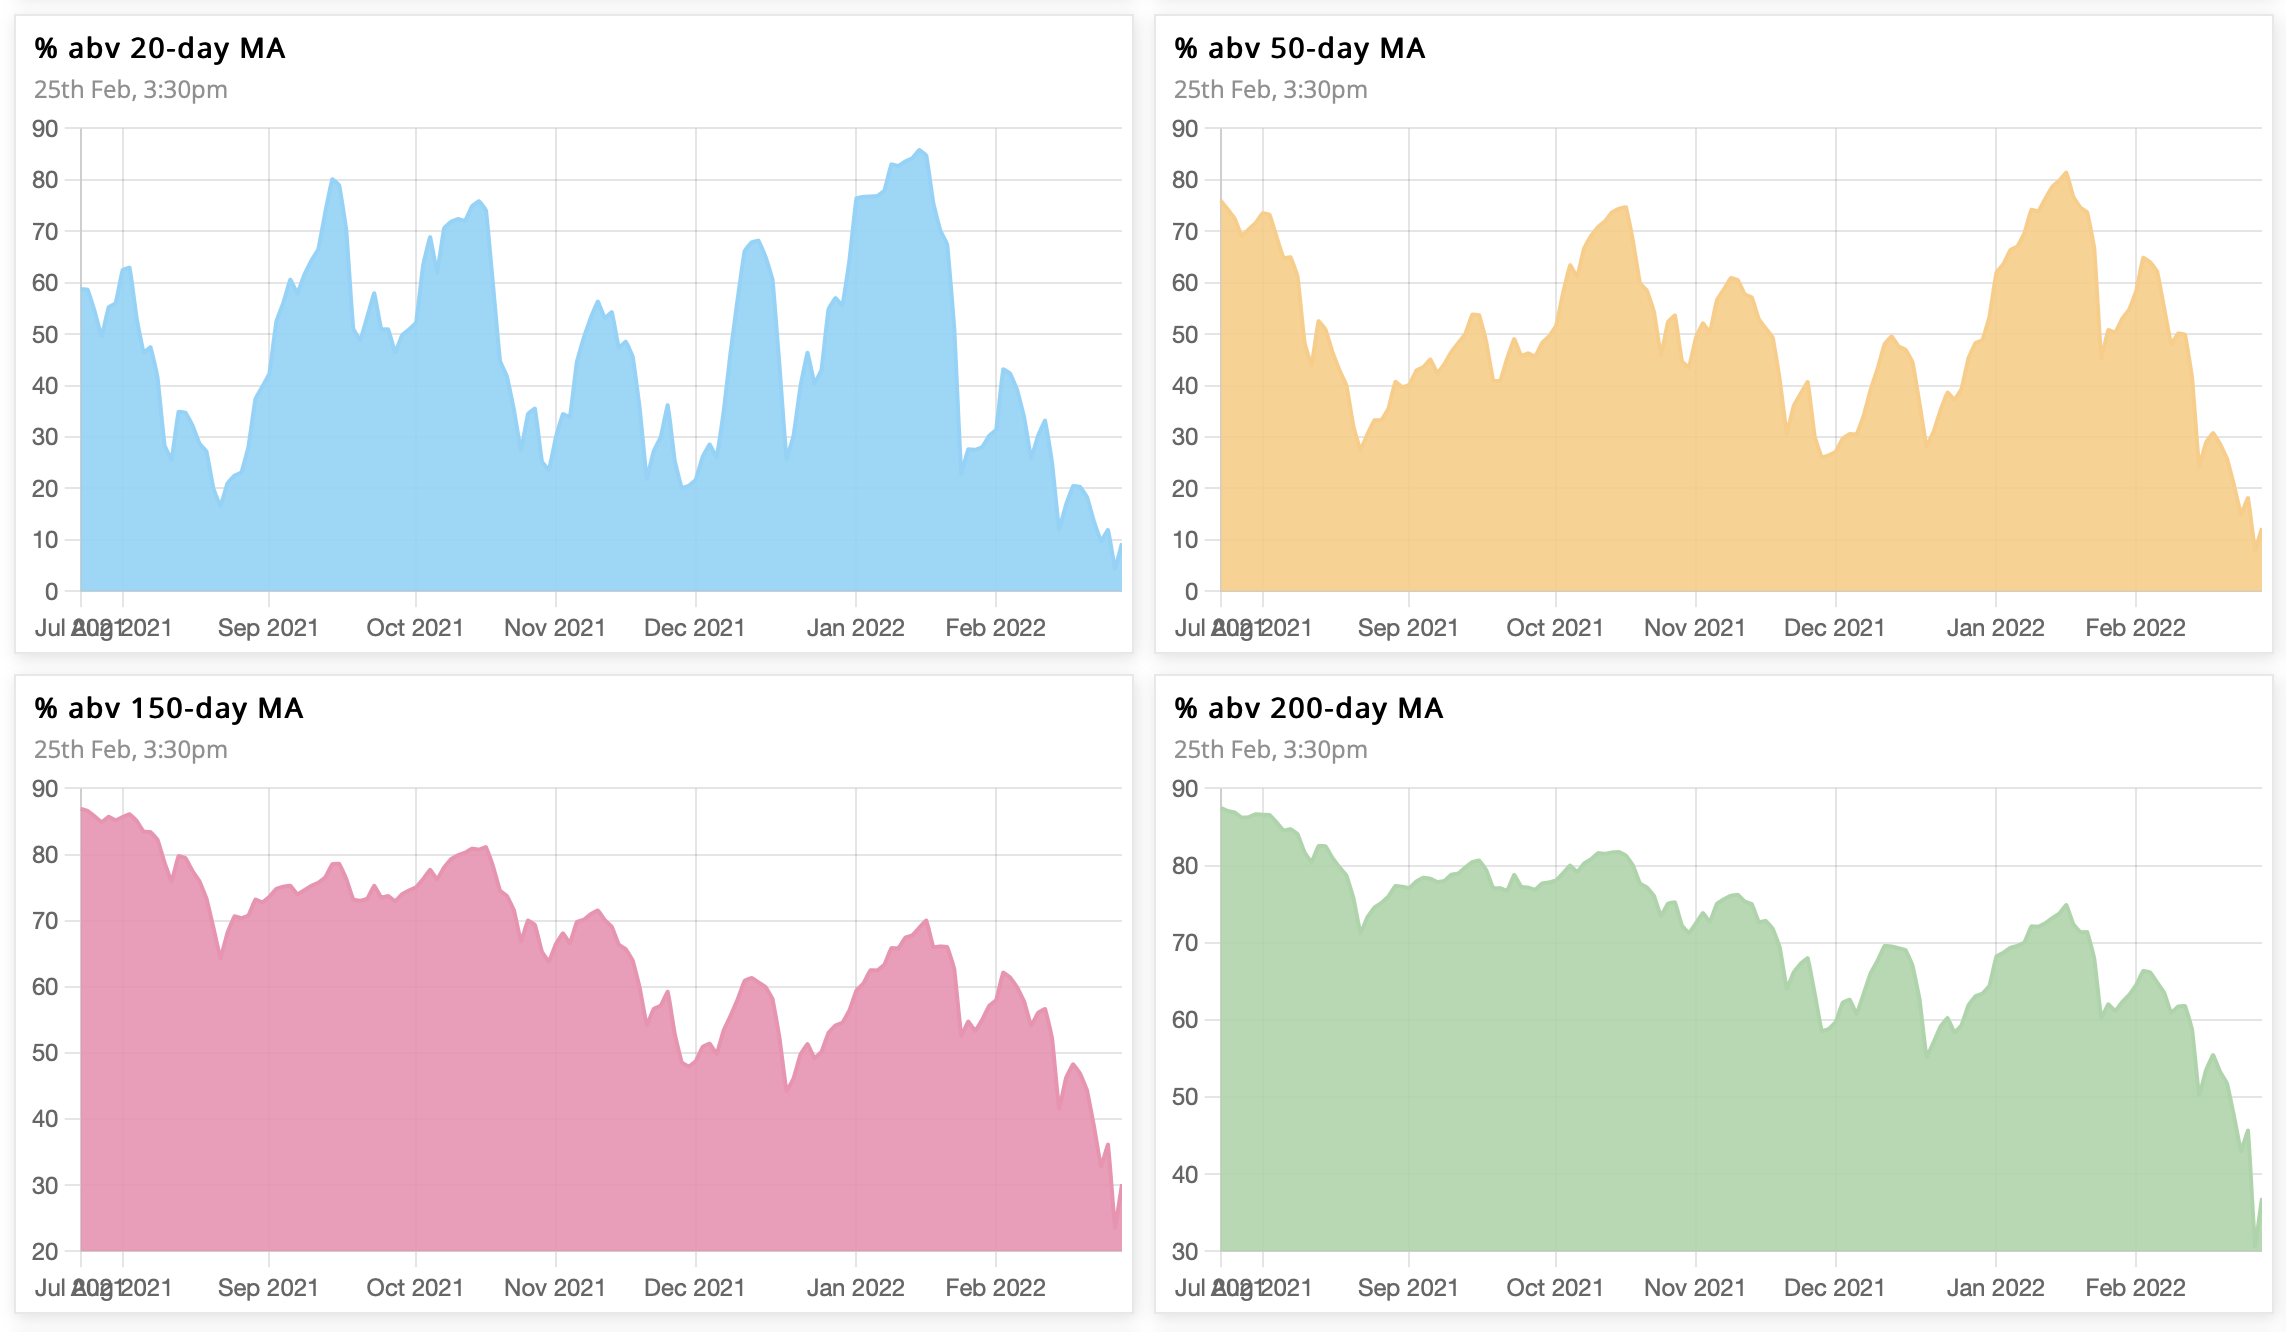
Market Breadth
While higher timeframes are now bearish, lower timeframes are oversold.
⦿ 18% → 9% above 20 SMA (oversold)
⦿ 25% → 12% above 50 SMA (oversold)
⦿ 44% → 30% above 150 SMA (bearish bias)
⦿ 51% → 36% above 200 SMA (bearish bias)
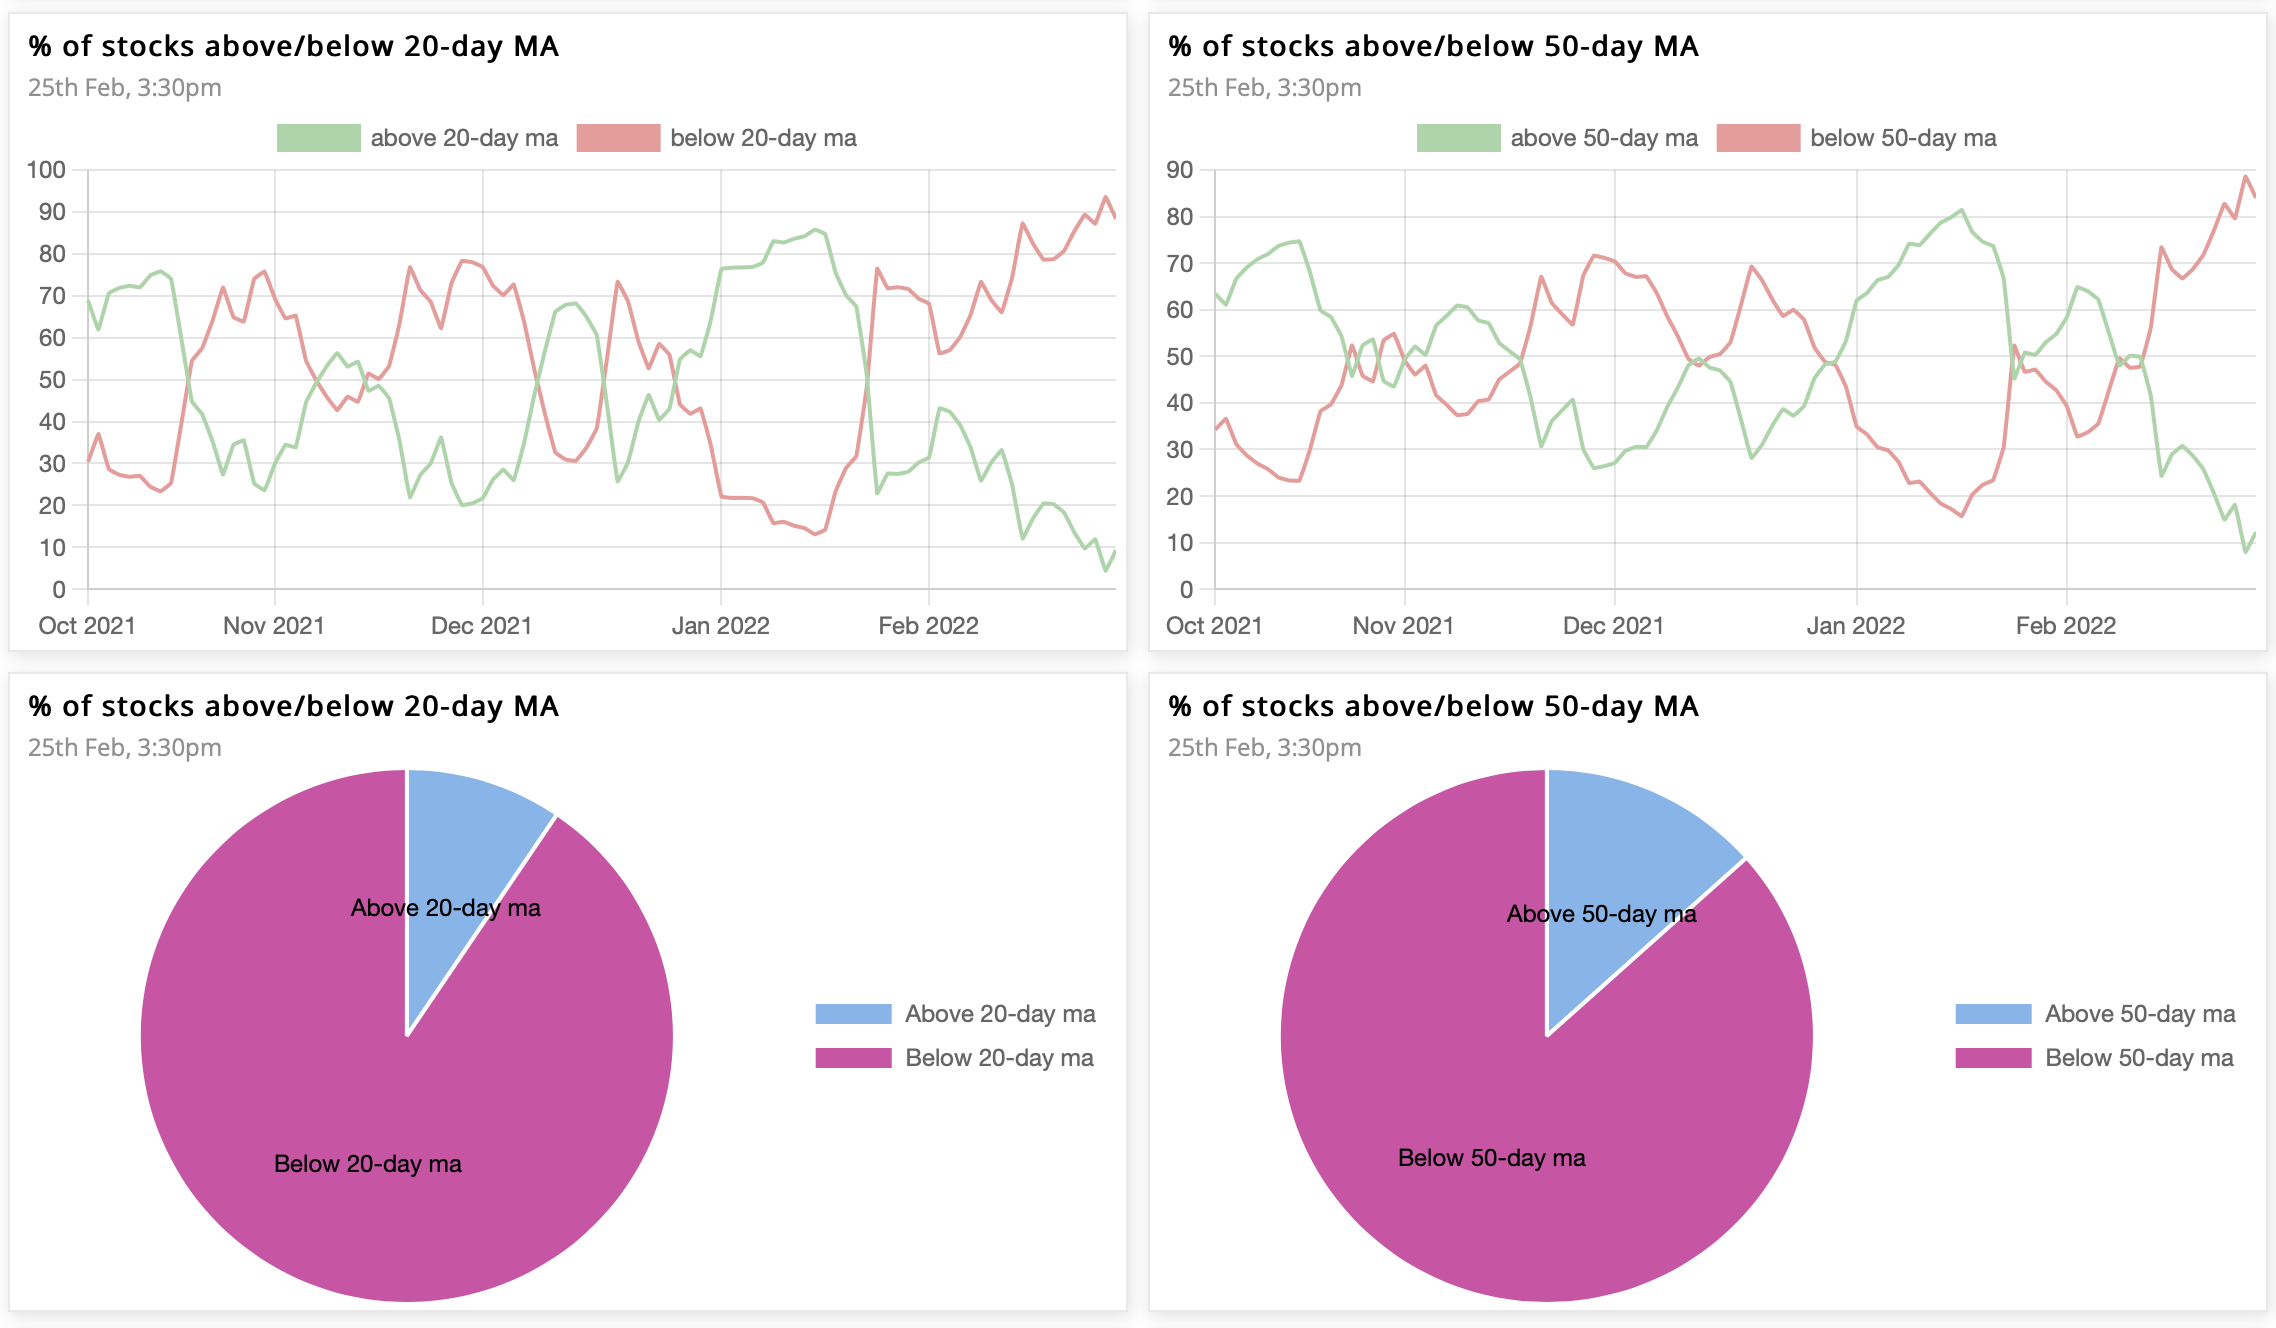
% of stocks above/below 20& 50MA
The Ratio between stocks above & below 50MA goes down to 0.15, while that for 20MA to 0.1. The 10-day cumulative ratio for stocks above 50MA is 0.24. A value >2 is good for swing trades on the long side.
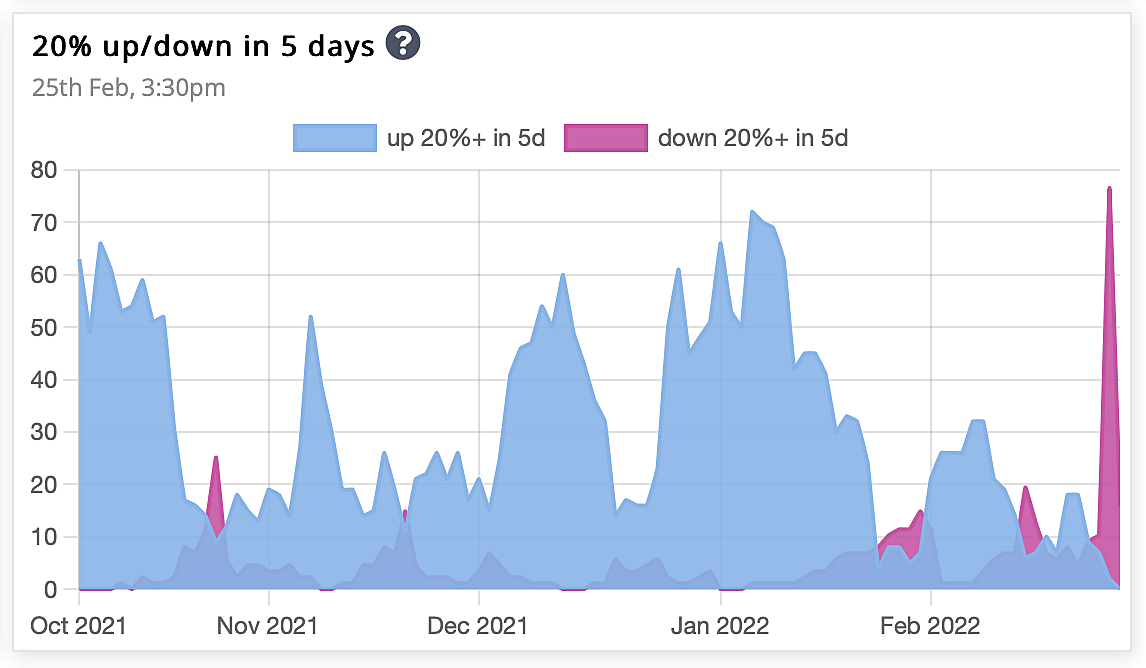
20% up/down in 5 days
The number of stocks up 20% in past 5 days is now less than those down 20% in 5 days. We’ve certainly seen better times than this.
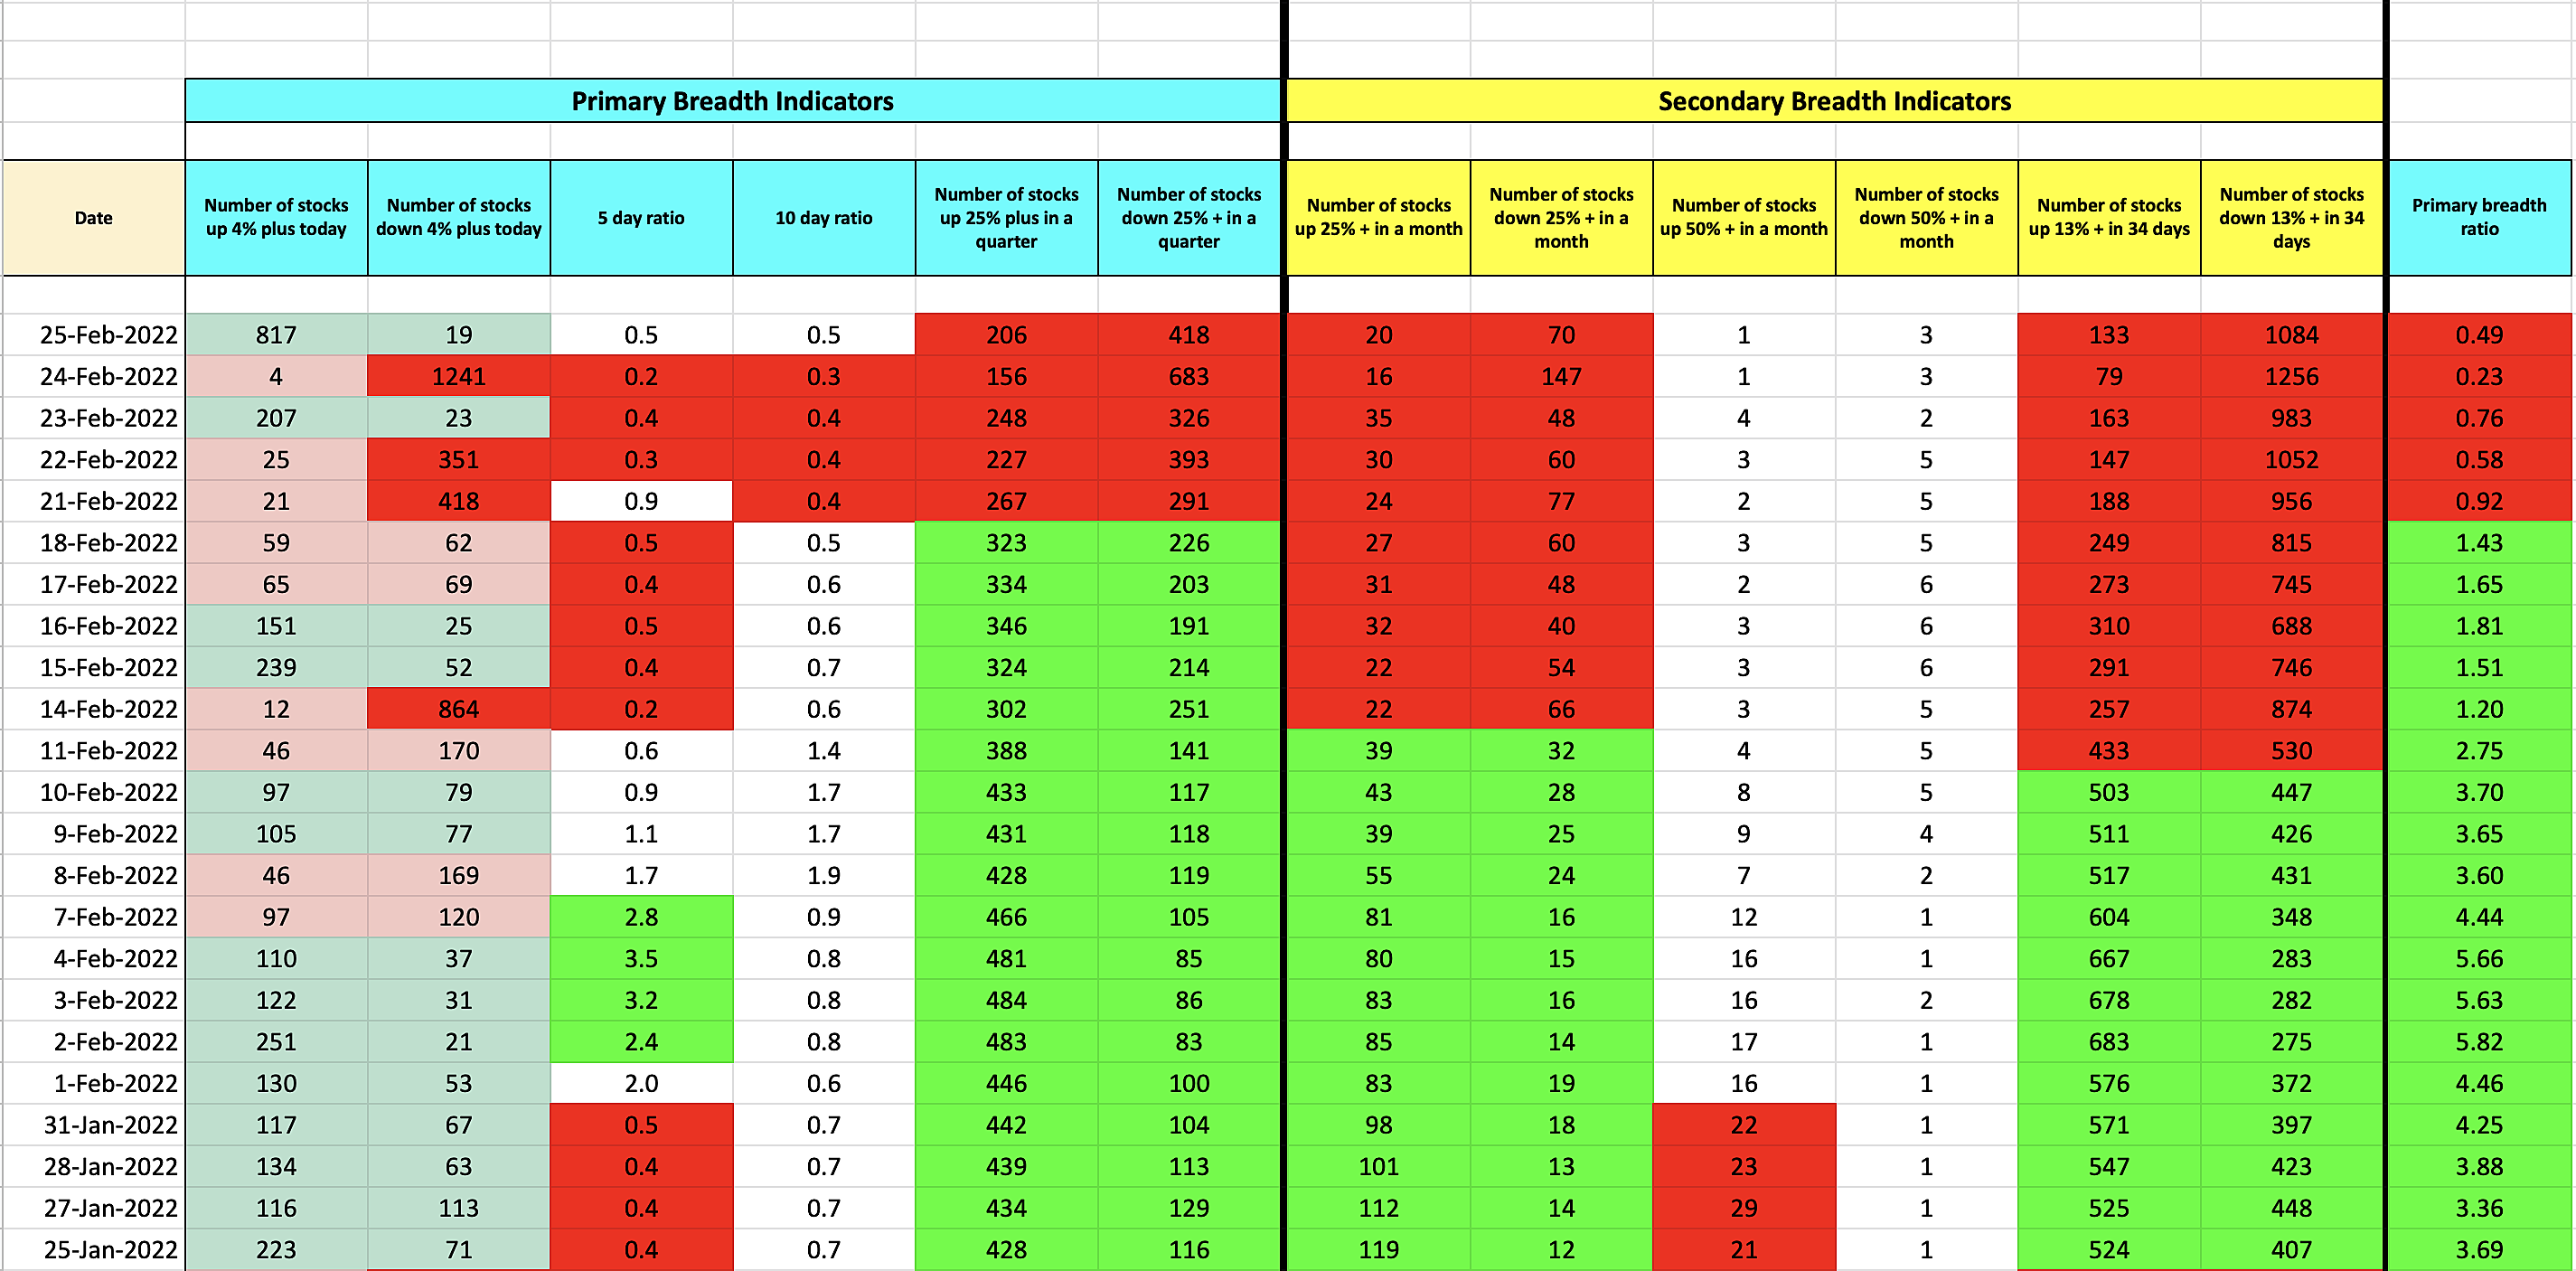
Stockbee Market Monitor
On a modified Stockbee market monitor, number of stocks 25% plus quarter is now less than 25% down quarter. This happened for just a day on 20-Dec-21, & prior to that in 2020 Covid crash.
Both 13% up in 34 days, & up 25% up in a month have stayed red, which shows bearish phase in the shorter-term as well.
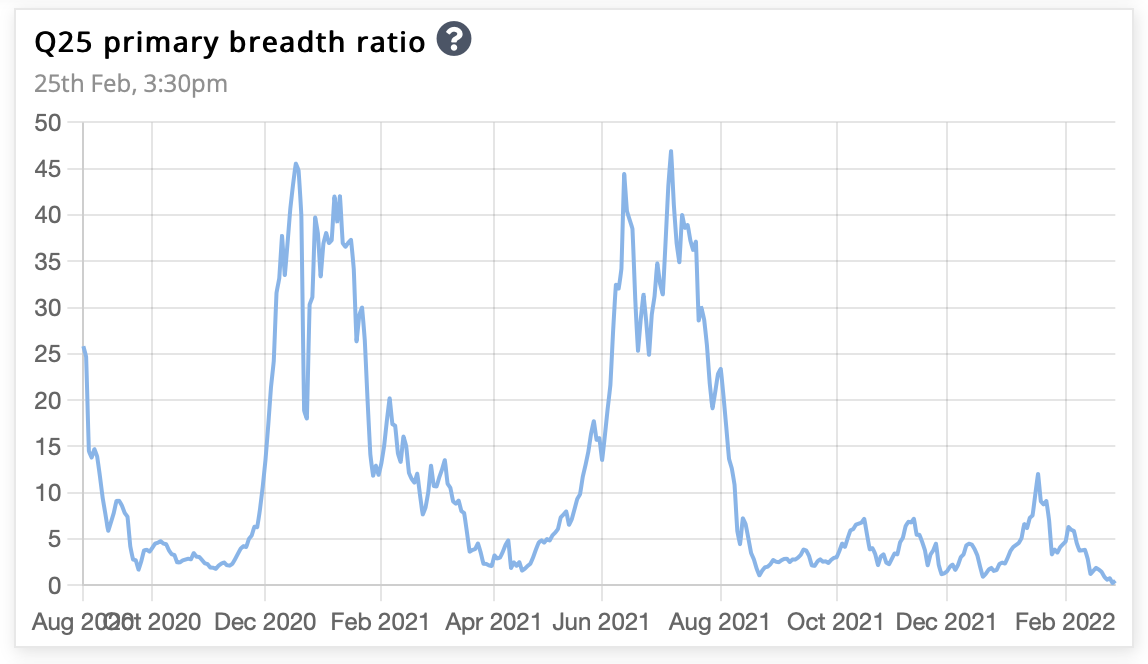
Primary Breadth ratio
Overall, the market is bearish, as the number of stocks up 25% plus in a quarter is less than that down 25% plus in a quarter. The ratio between the two is the primary breadth ratio, which is now less than 1.
That’s all for this week. If you'd like to know when I publish something new, just subscribe to my newsletter and you'll get the latest sent direct to you.
.png)
.png?disposition=attachment)