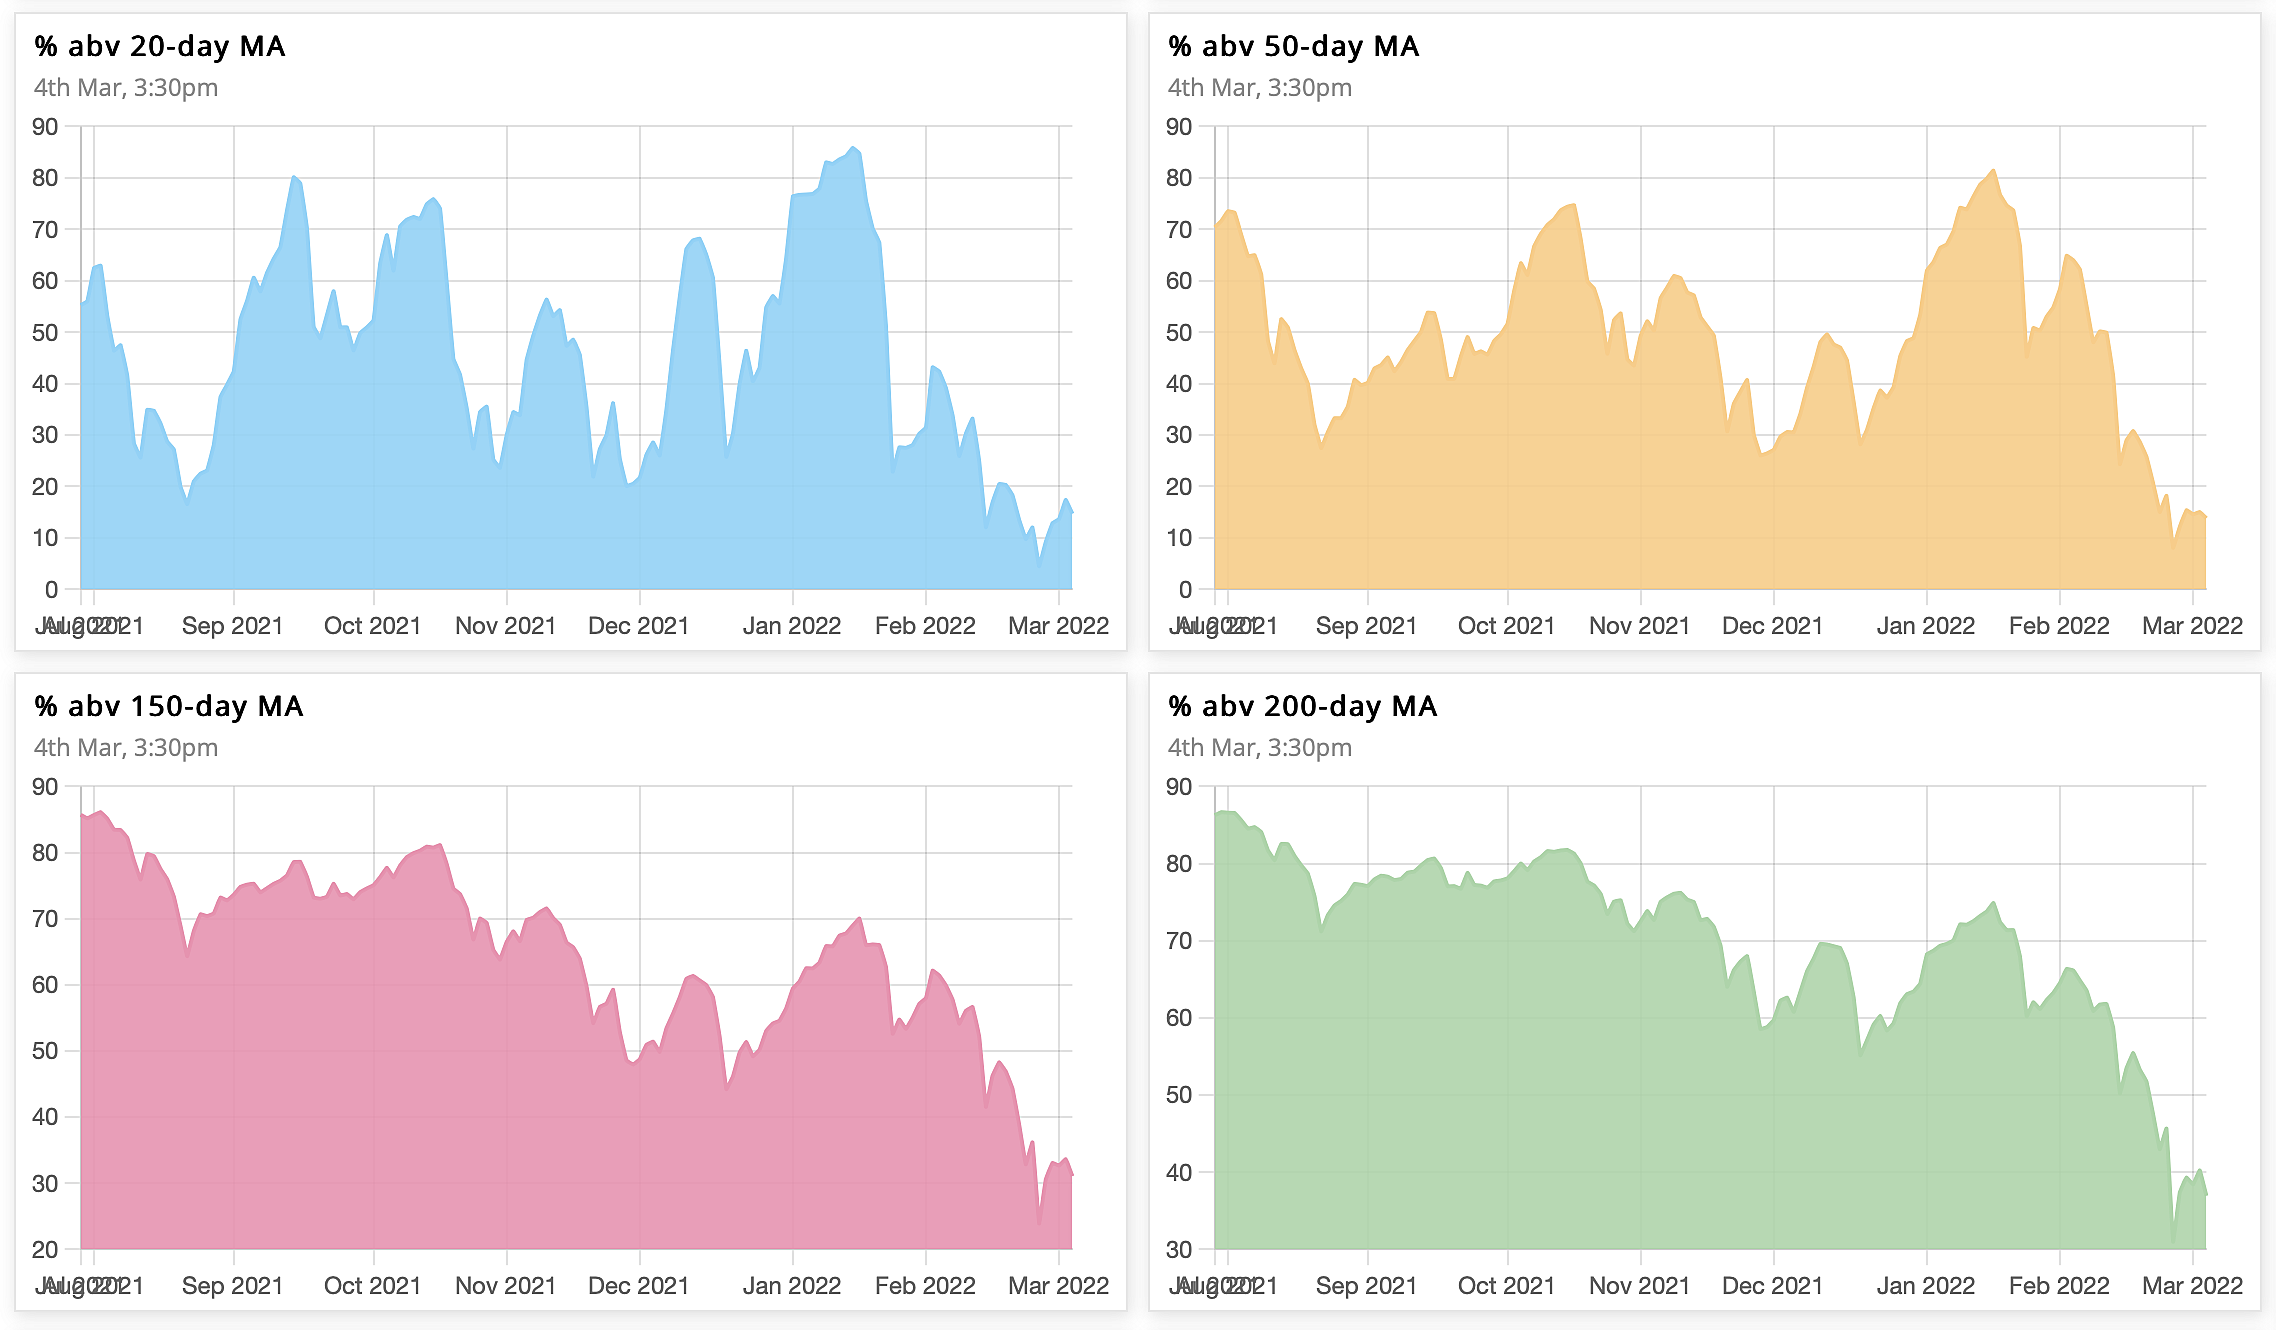
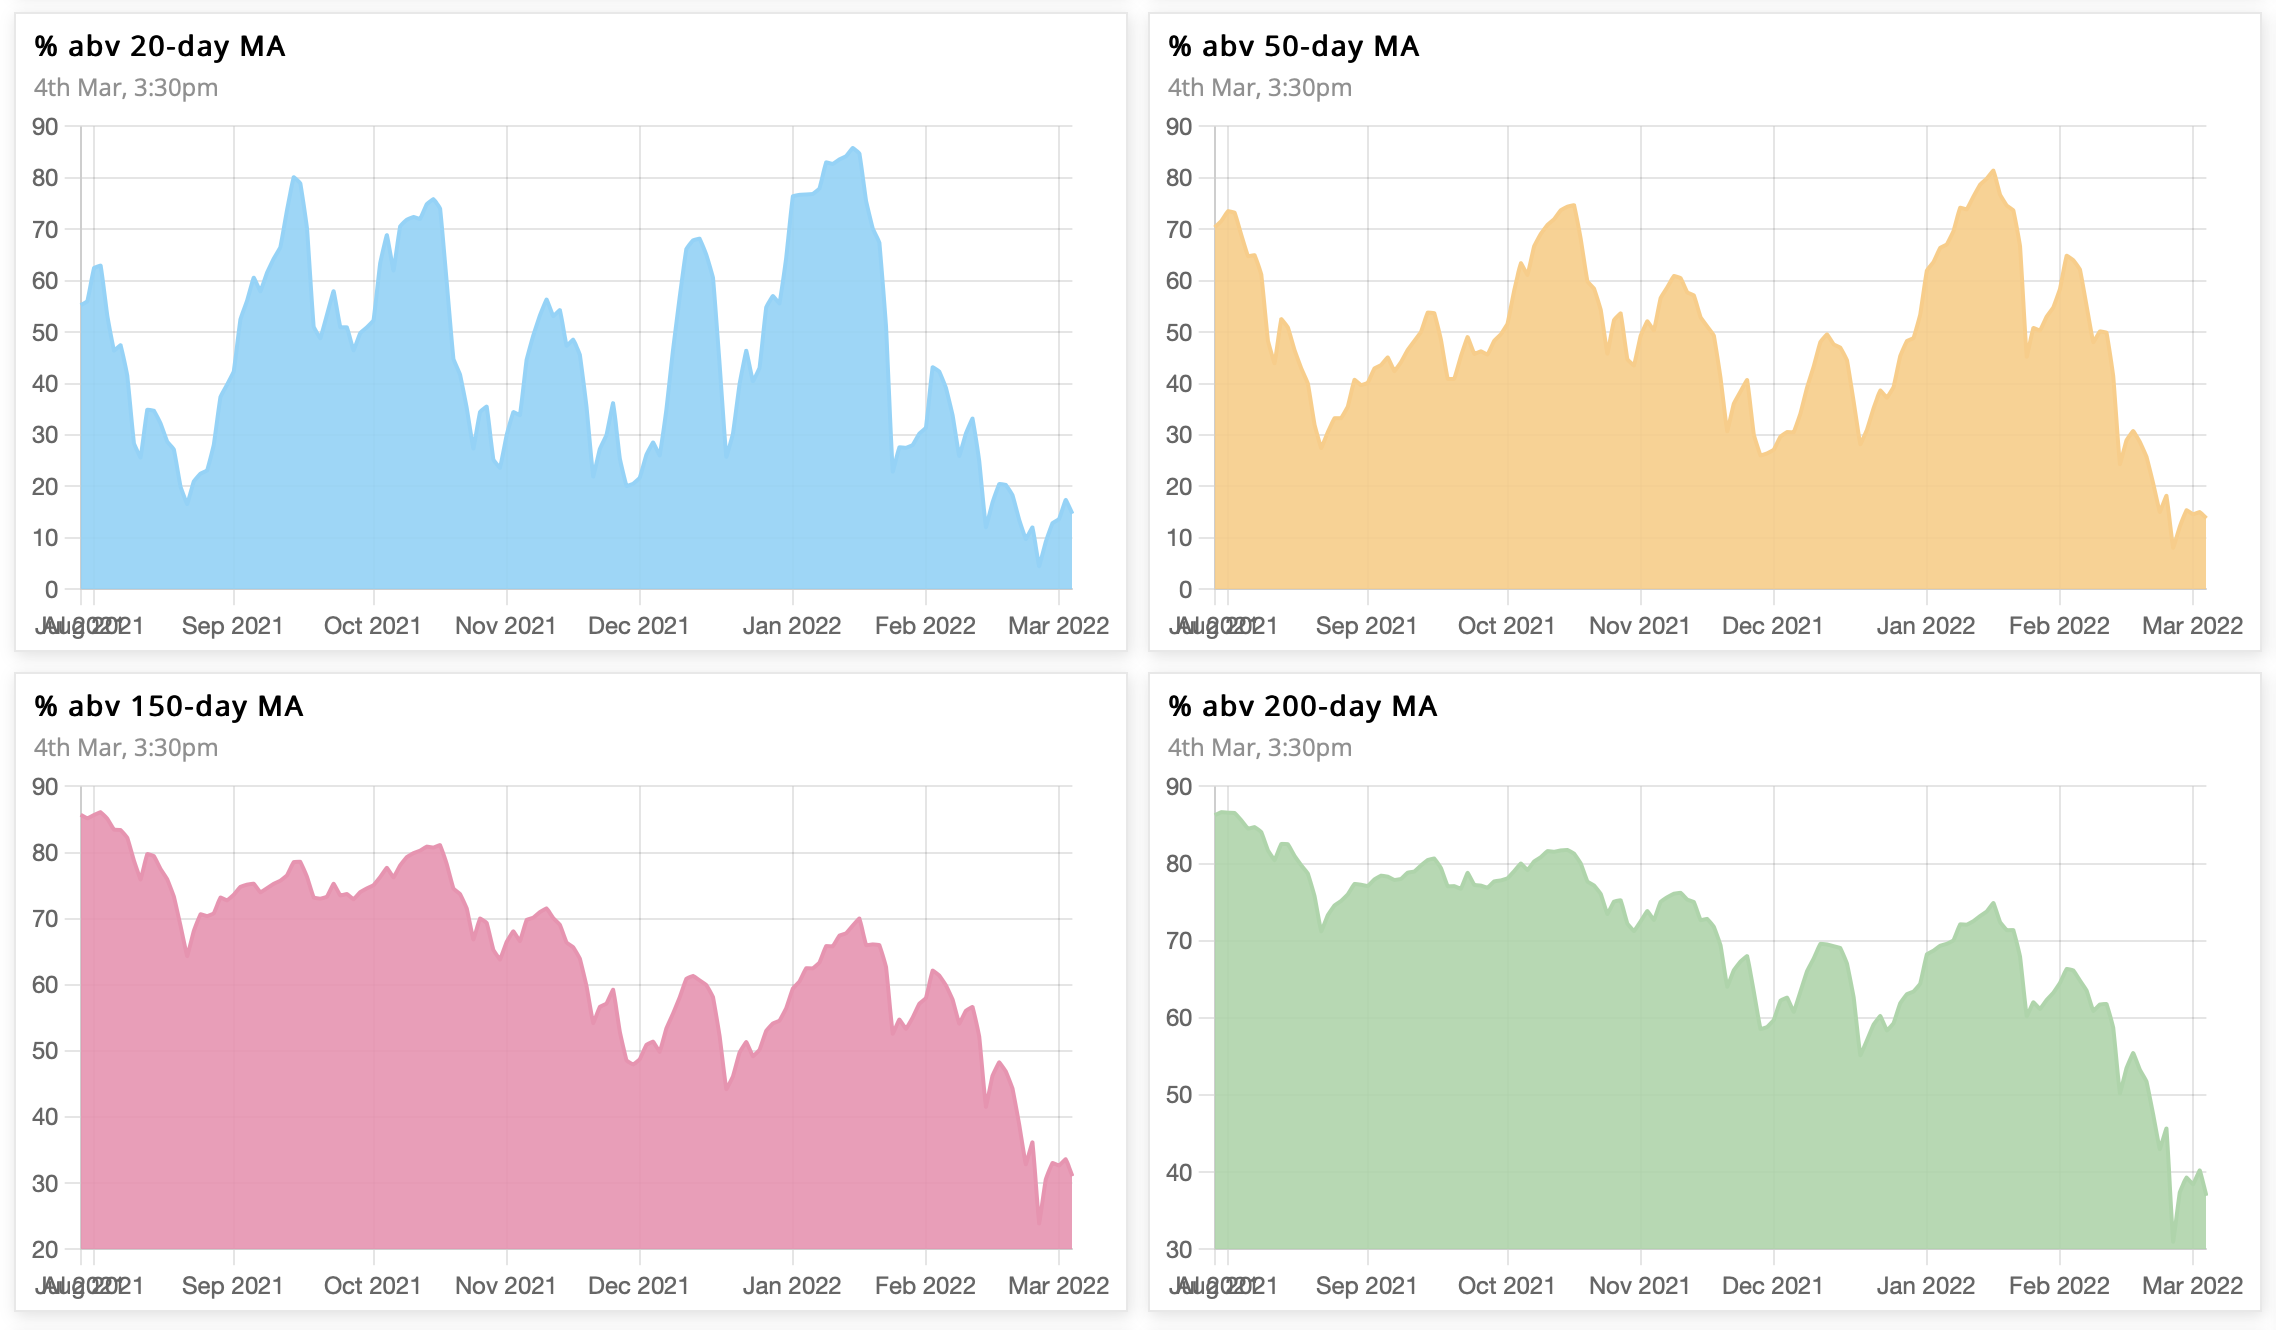
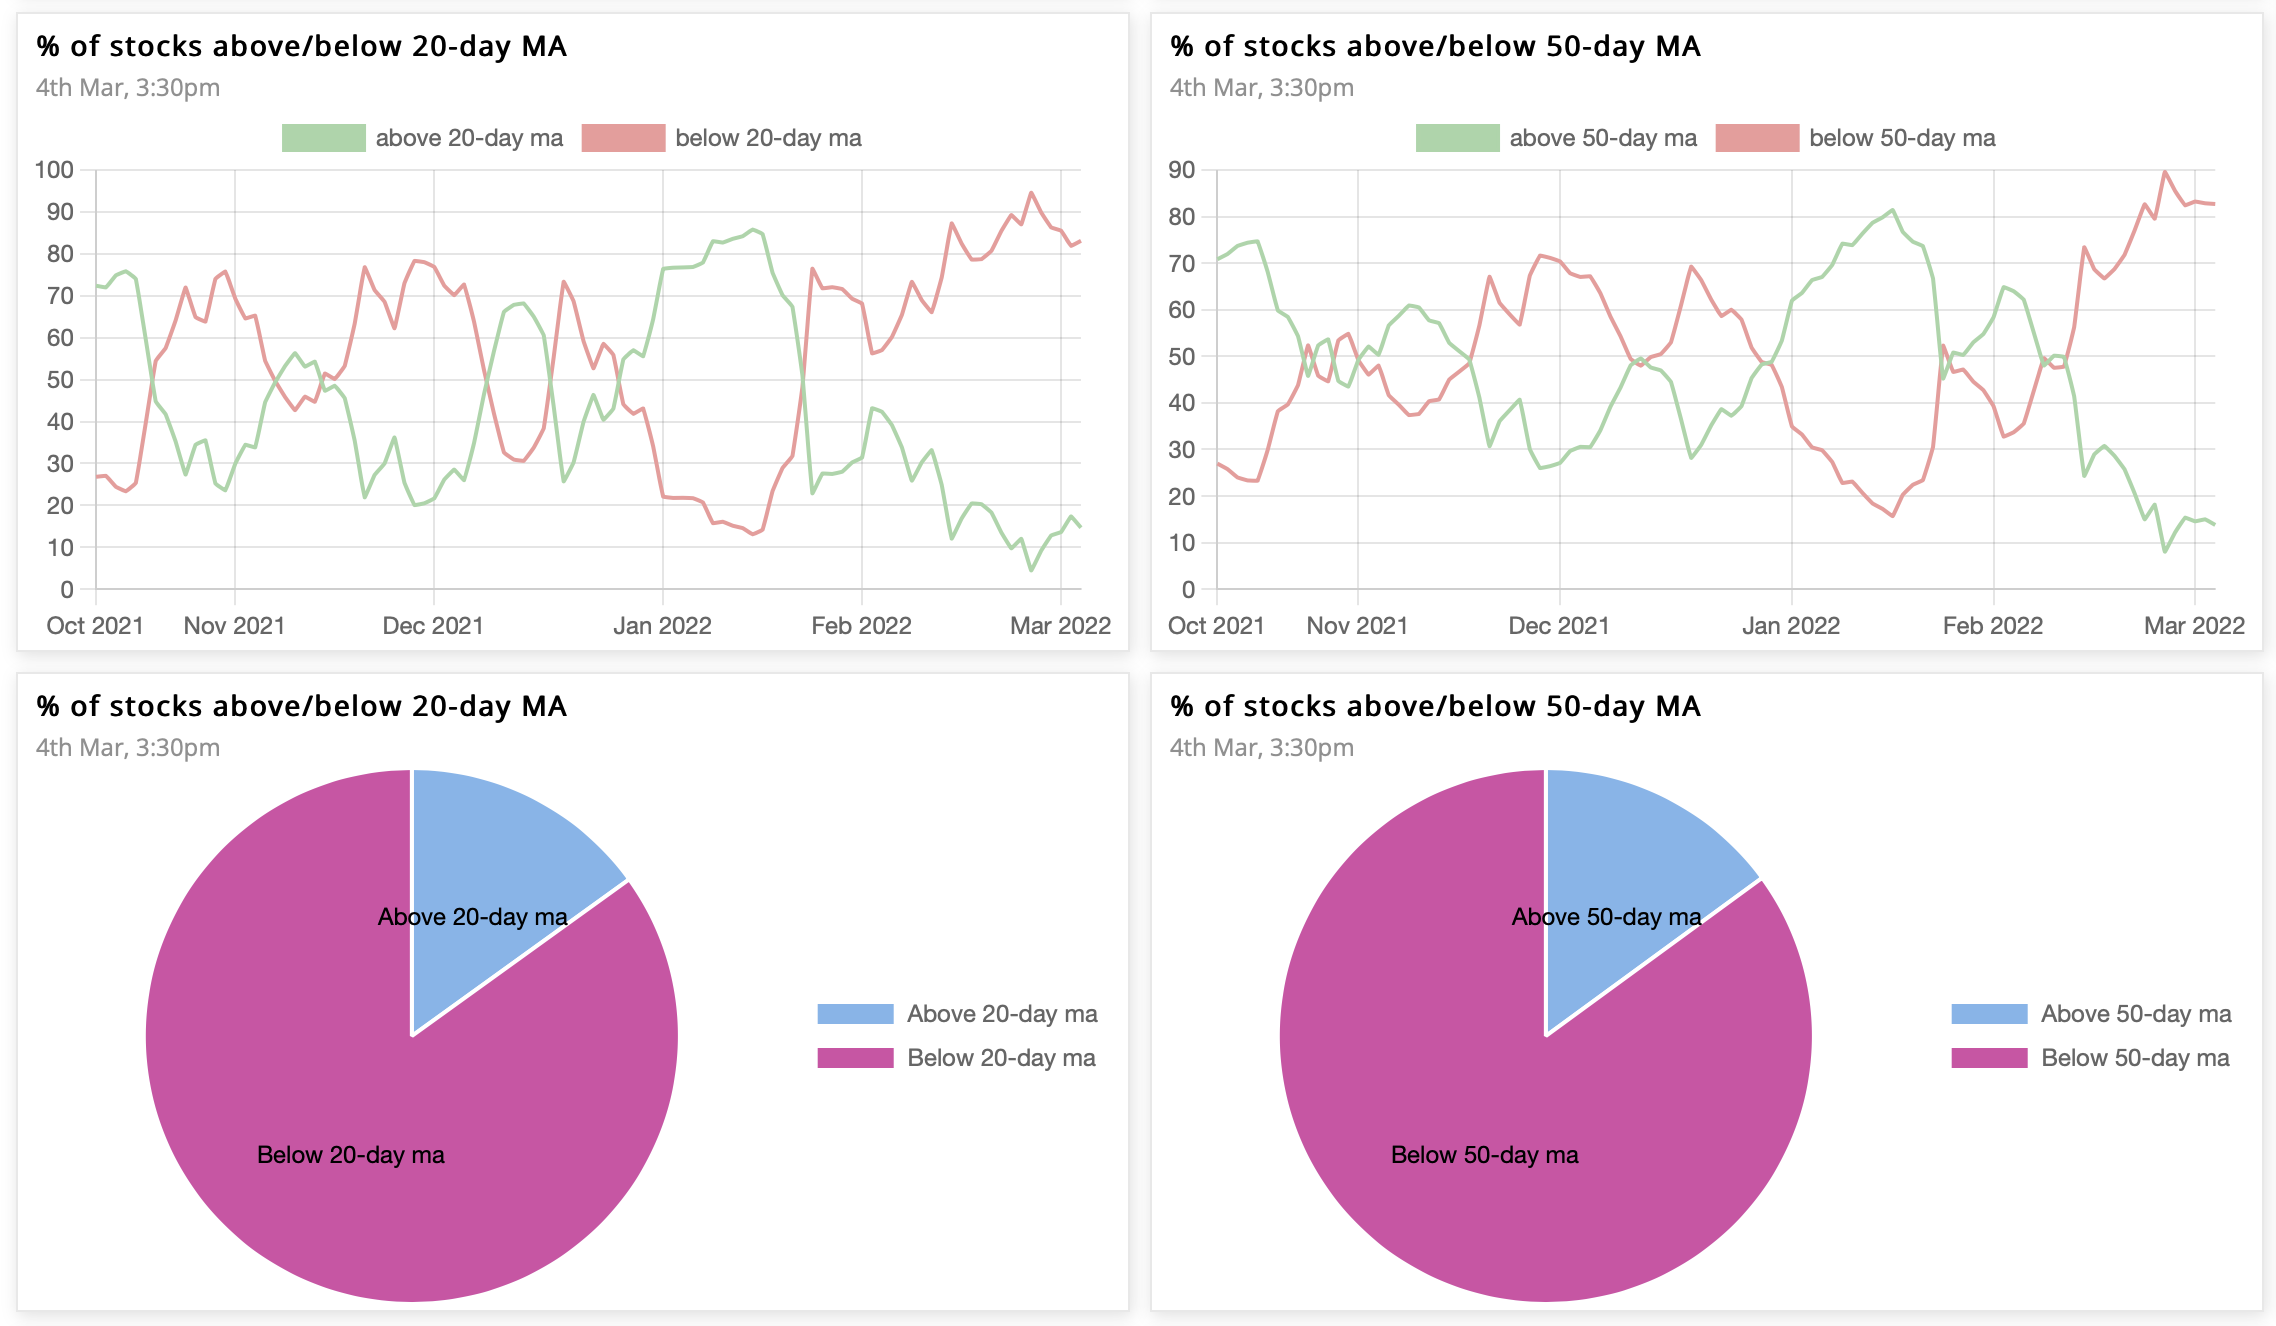
The Ratio between stocks above & below 50MA is now 0.17, while that for 20MA is 0.17.
The 10-day cumulative ratio for stocks above 50MA is 0.15.
A value >2 is good for swing trades on the long side.
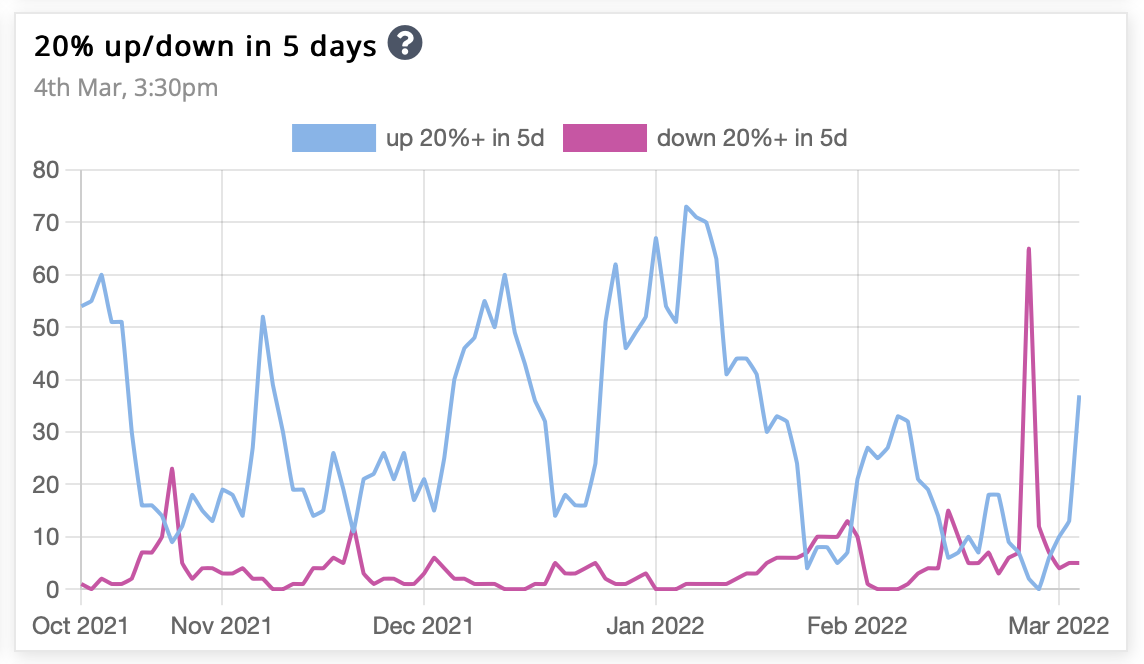
20% up/down in 5 days
The number of stocks up 20% in past 5 days is back to being greater than those down 20% in 5 days. Such brief bullish upthrusts are trading oppurtunites in the very short-term.
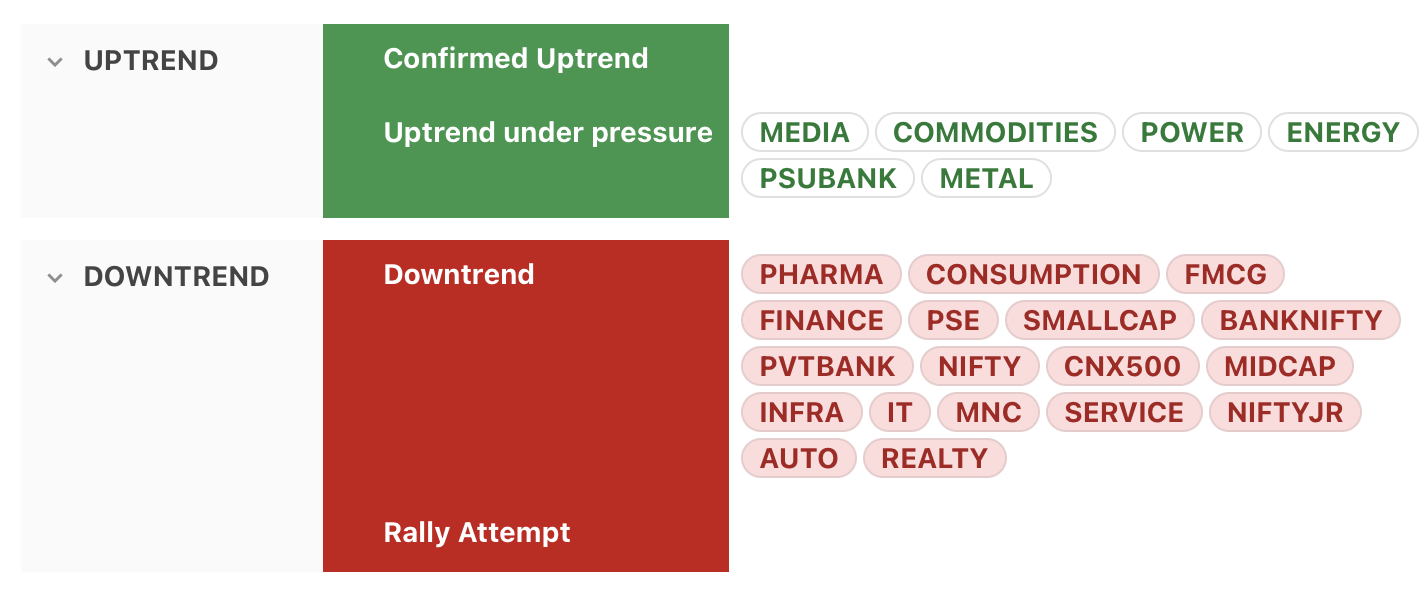
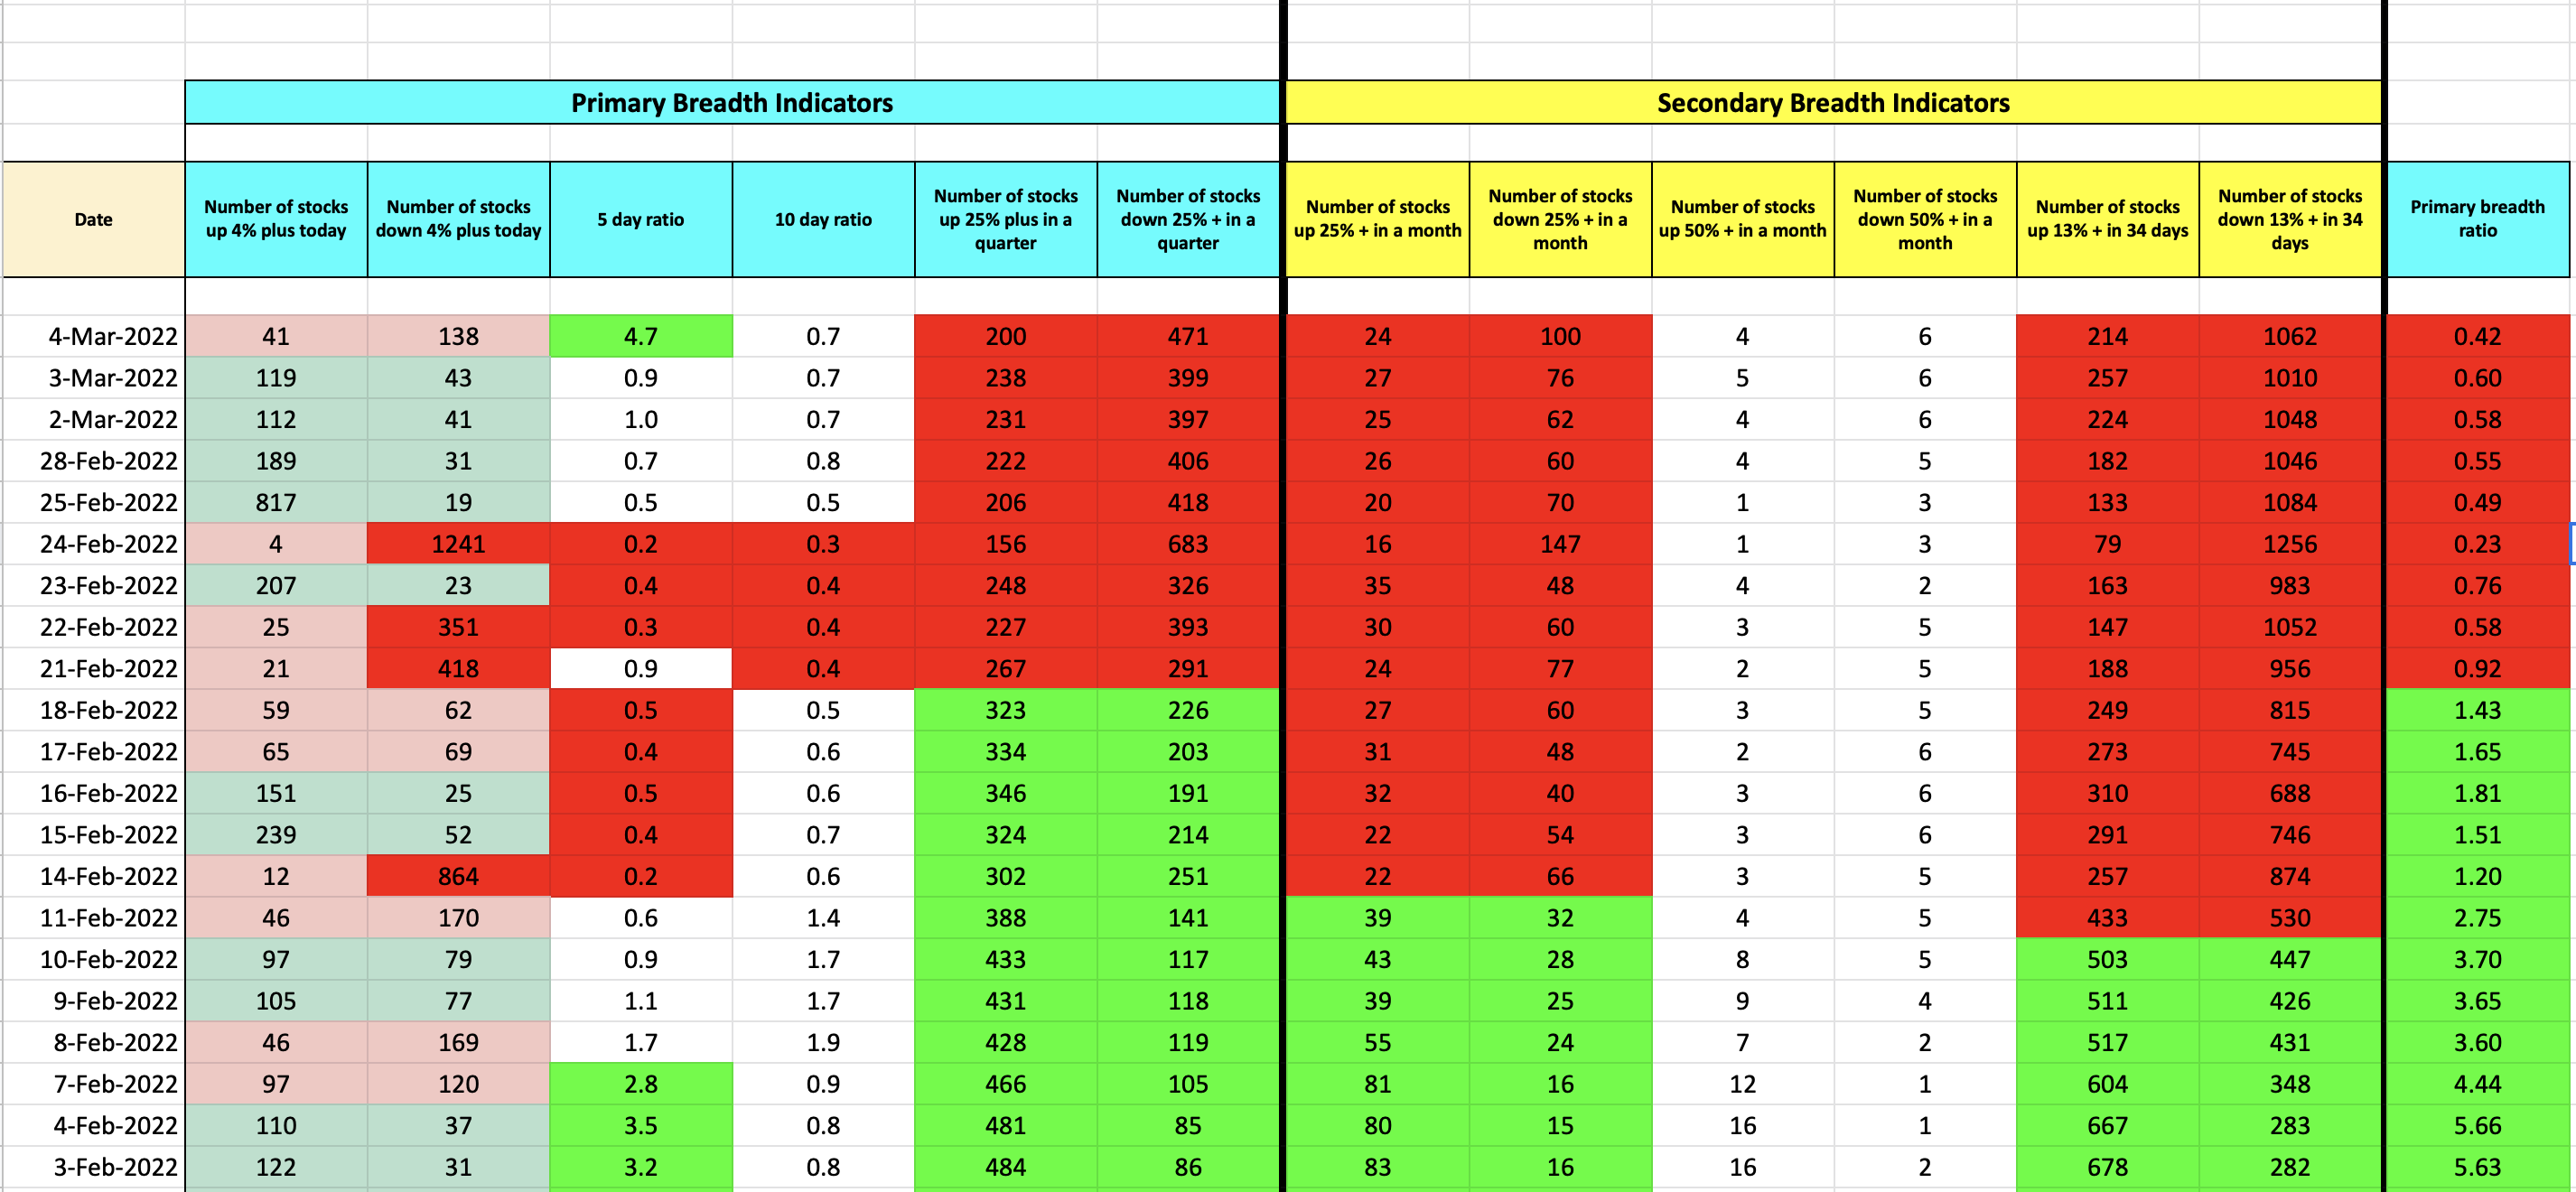
Stockbee Market Monitor
On a modified Stockbee market monitor, number of stocks 25% plus quarter stays less than 25% down quarter for second consecutive week.
Both 13% up in 34 days, & up 25% up in a month have stayed red, which shows bearish phase in the shorter-term as well.
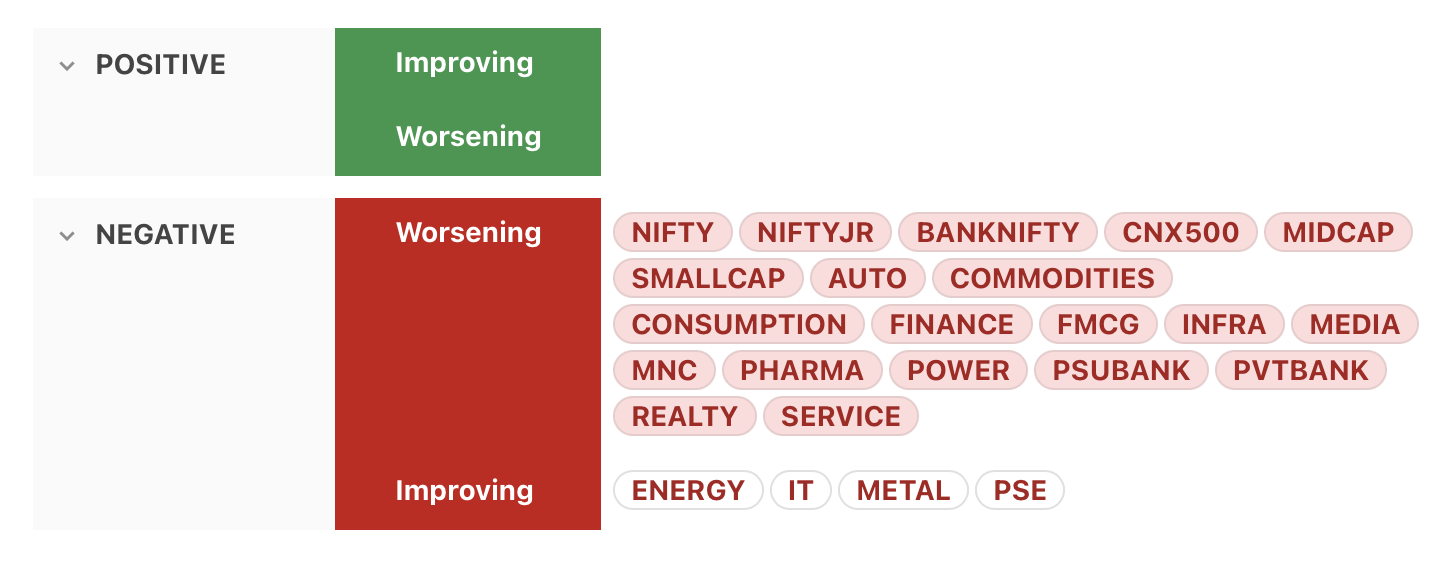
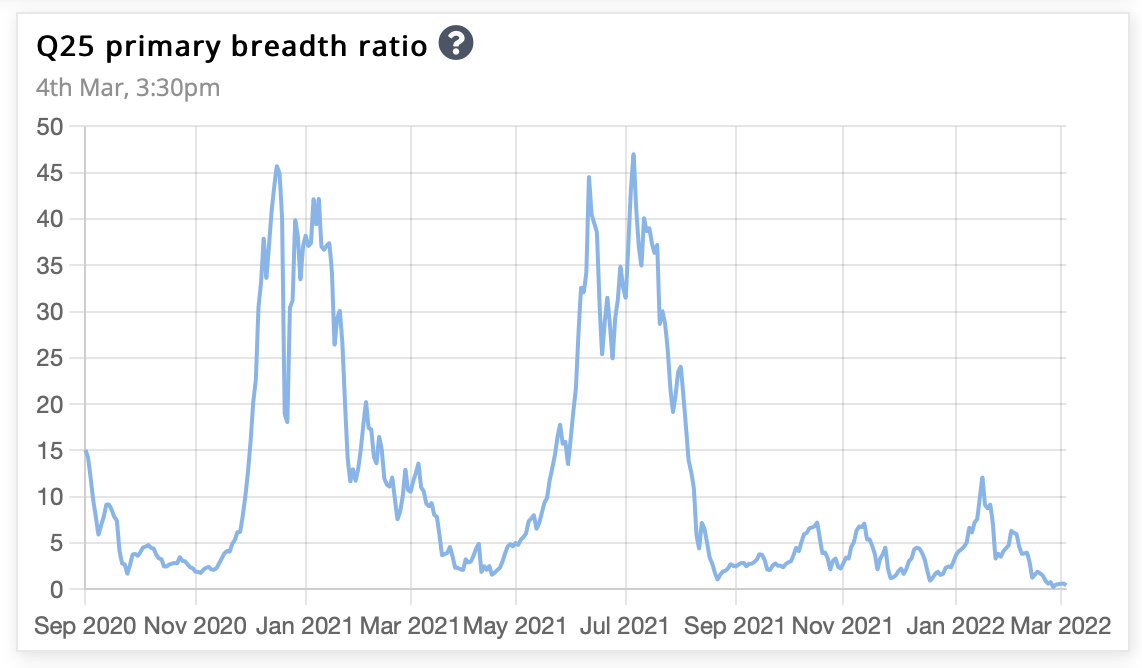
Primary Breadth Ratio
Overall, the market is bearish, as the number of stocks up 25% plus in a quarter is less than that down 25% plus in a quarter.
The ratio between the two is the primary breadth ratio, which is now less than 1.
That’s all for this week. If you'd like to know when I publish something new, just subscribe to my newsletter and you'll get the latest sent direct to you.