⦿ Bias: Bearish on all timeframes (except the very short-term)
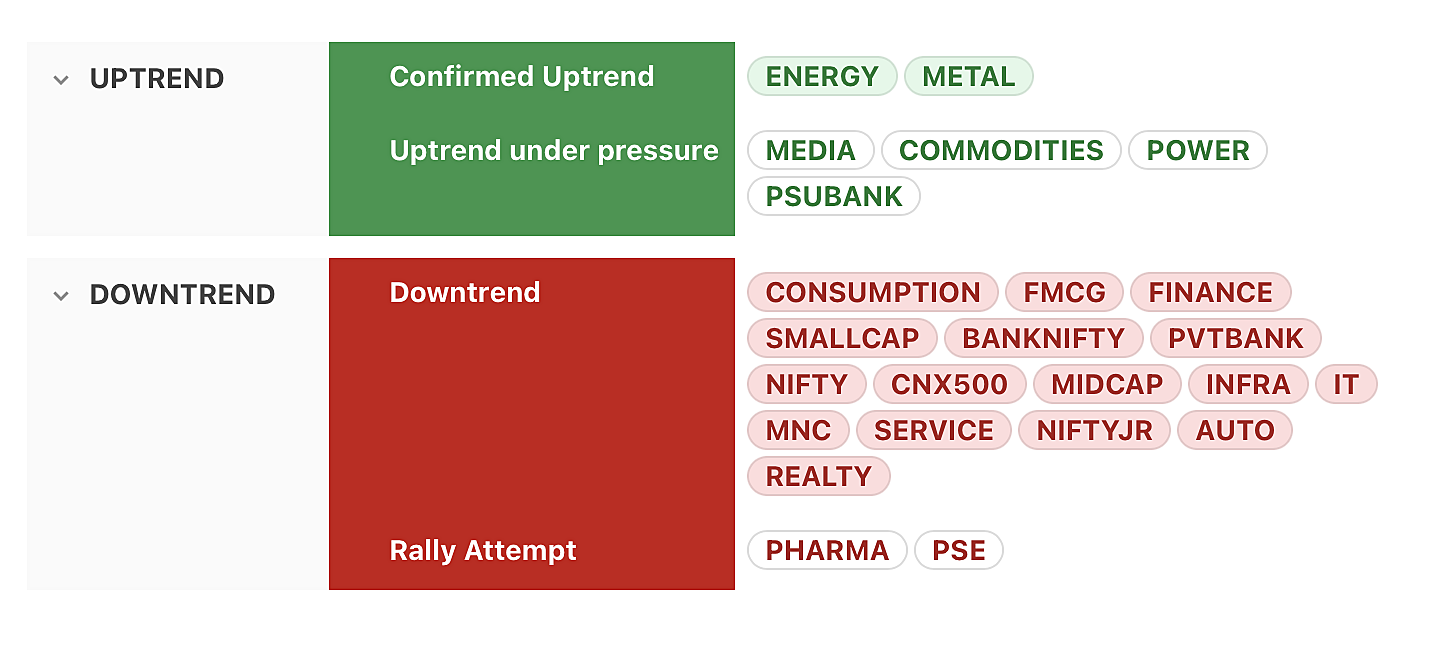
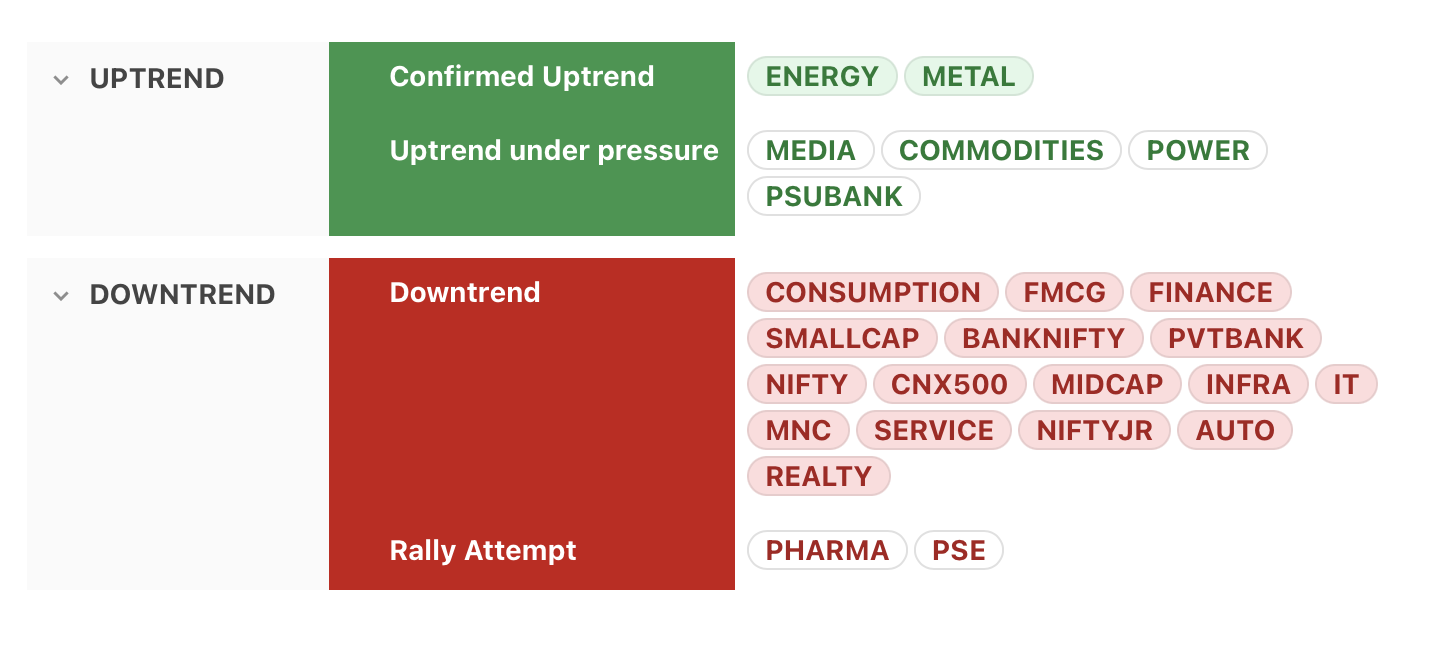
Trend
⦿ Most major indices (including Nifty, CNX500, Midcap, Smallcap) stay in downtrend.
⦿ Energy & Metal are the first indices to regain the confirmed uptrend status
⦿ Pharma & PSE in rally attempt
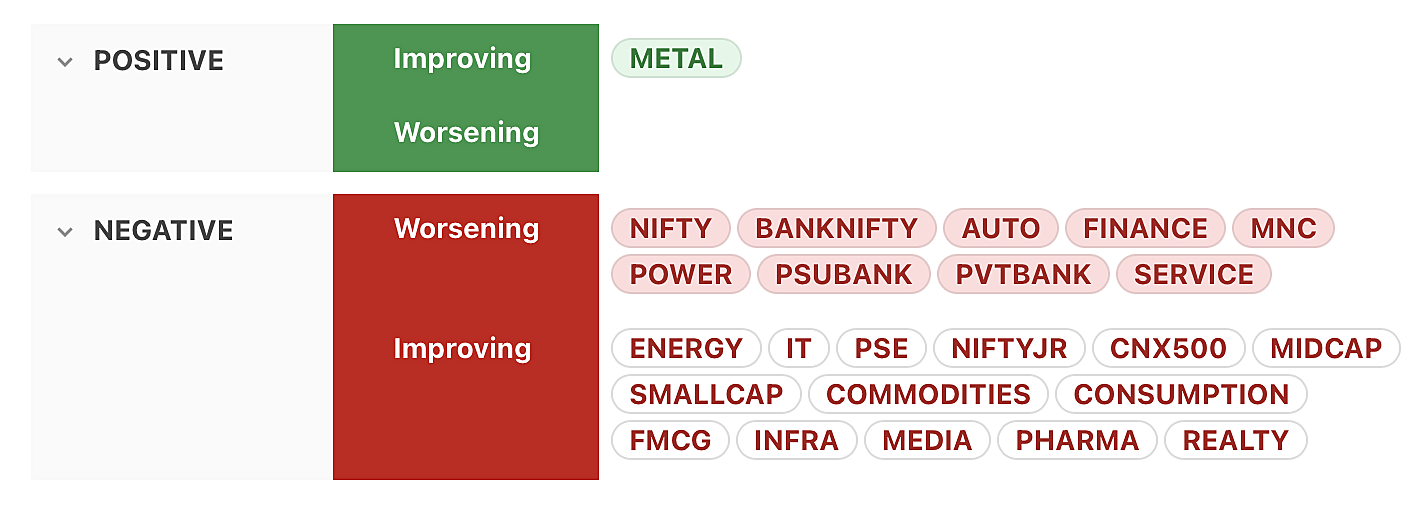
Momentum
⦿ Metal index is the first one to regain positive momentum
⦿ Most indices (including CNX500, Midcap & Smallcap) have negative but improving momentum
⦿ Many indices (including Nifty & Banknifty) are still showing negative & worsening momentum
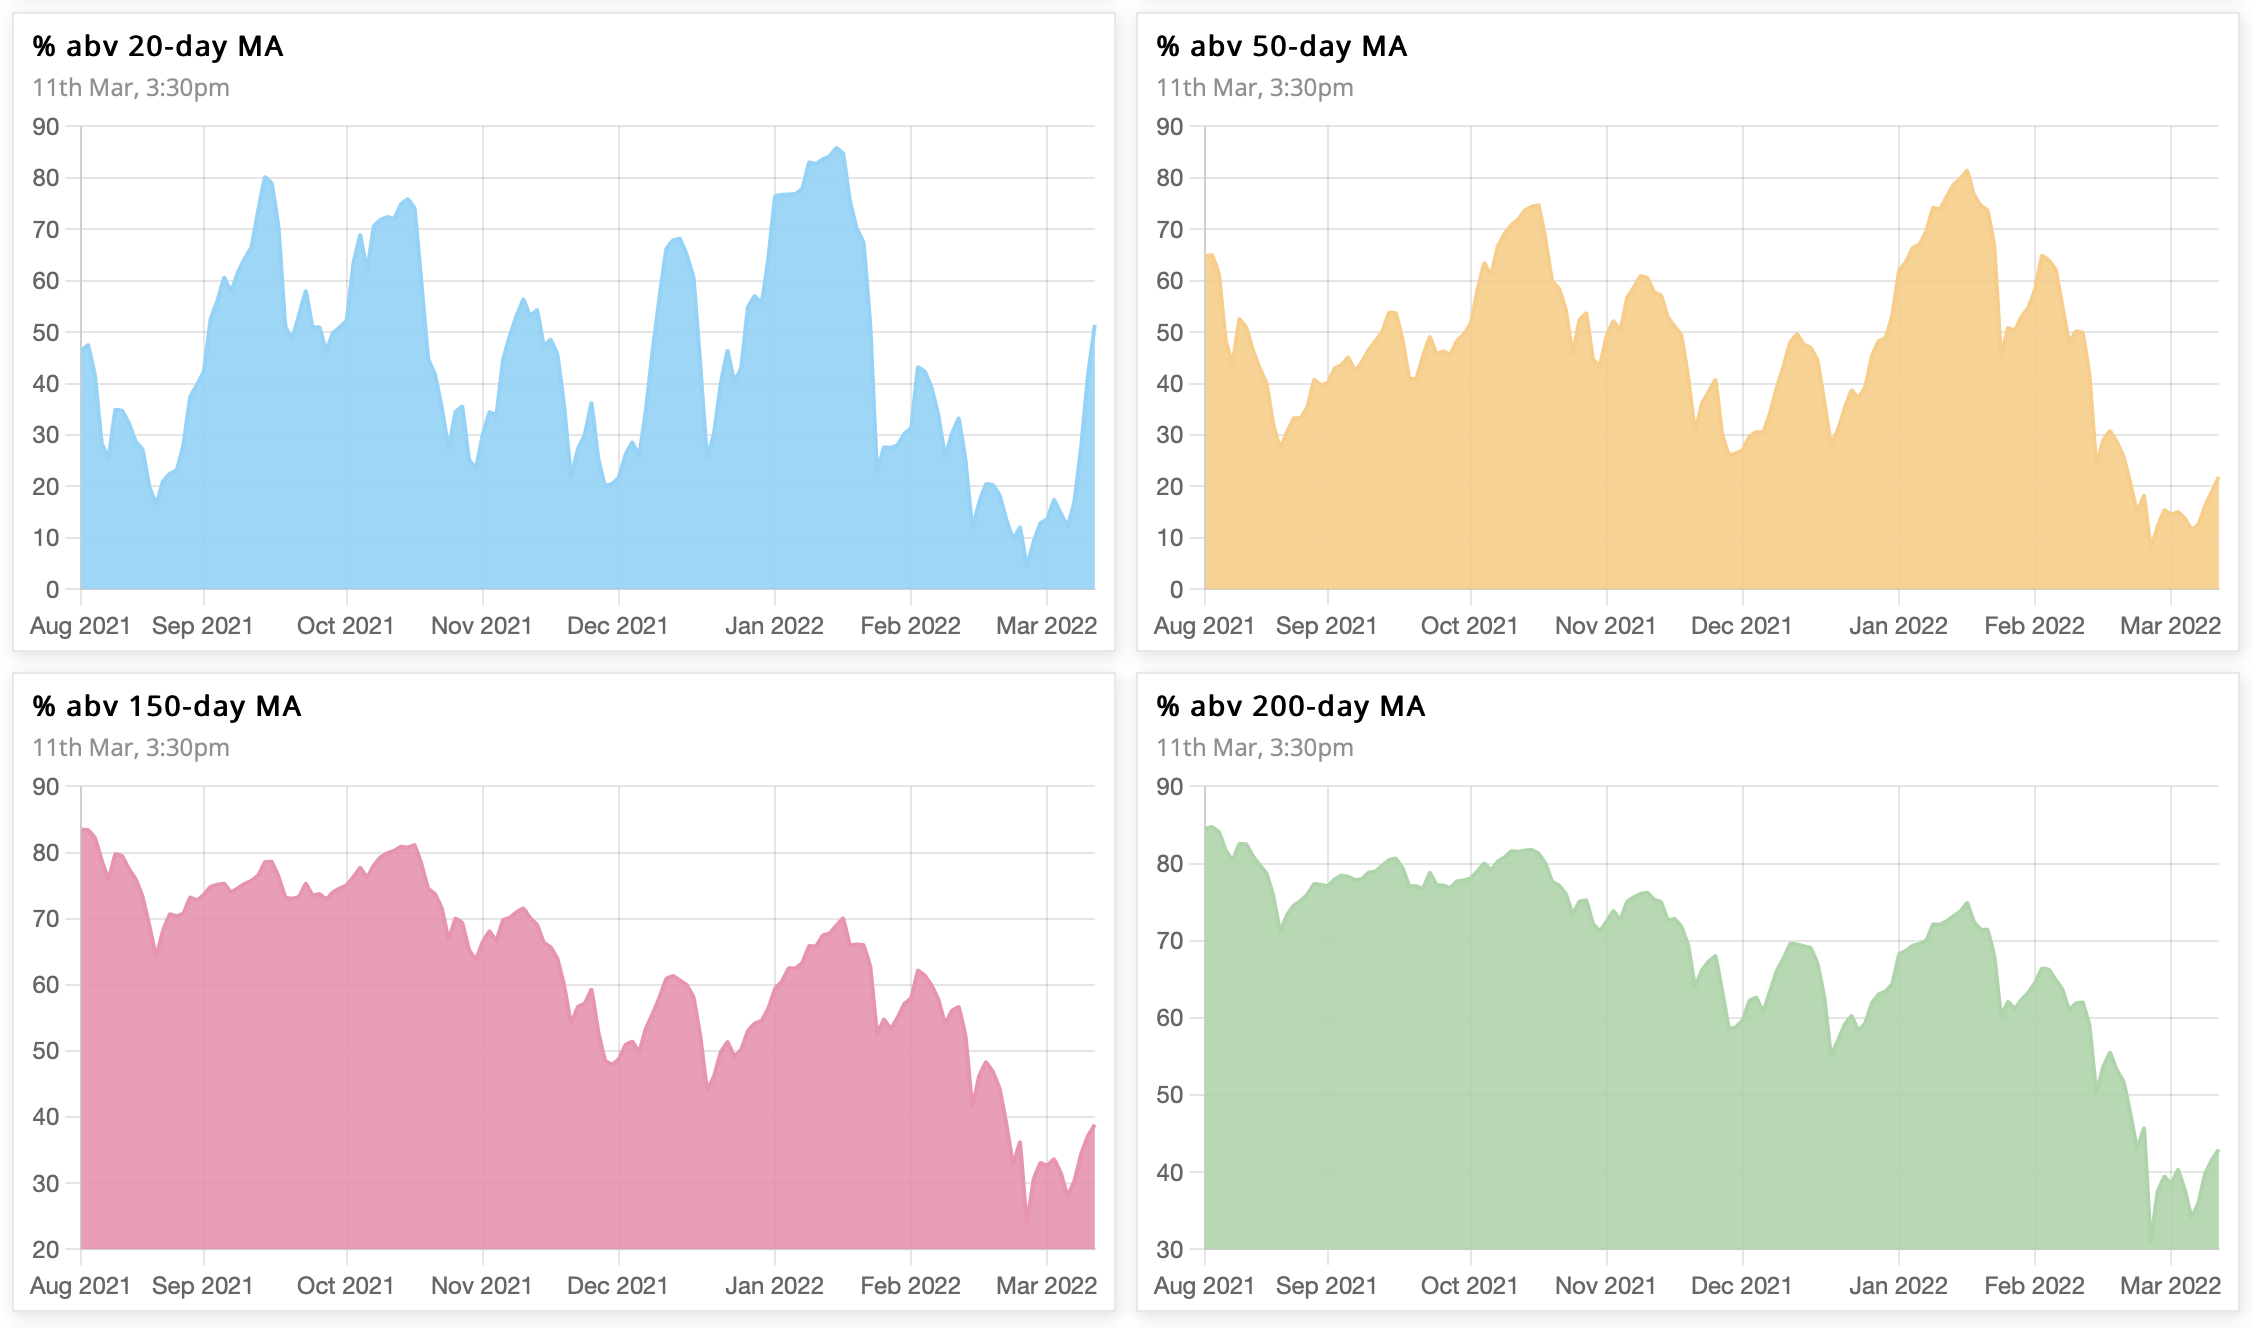
Market Breadth
Higher timeframes stay bearish, but a fresh buy signal on very short-term timeframes.
⦿ 14% → 51% above 20 MA (buy signal)
⦿ 13% → 21% above 50 MA (near oversold)
⦿ 31% → 38% above 150 MA (bearish bias)
⦿ 37% → 42% above 200 MA (bearish bias)
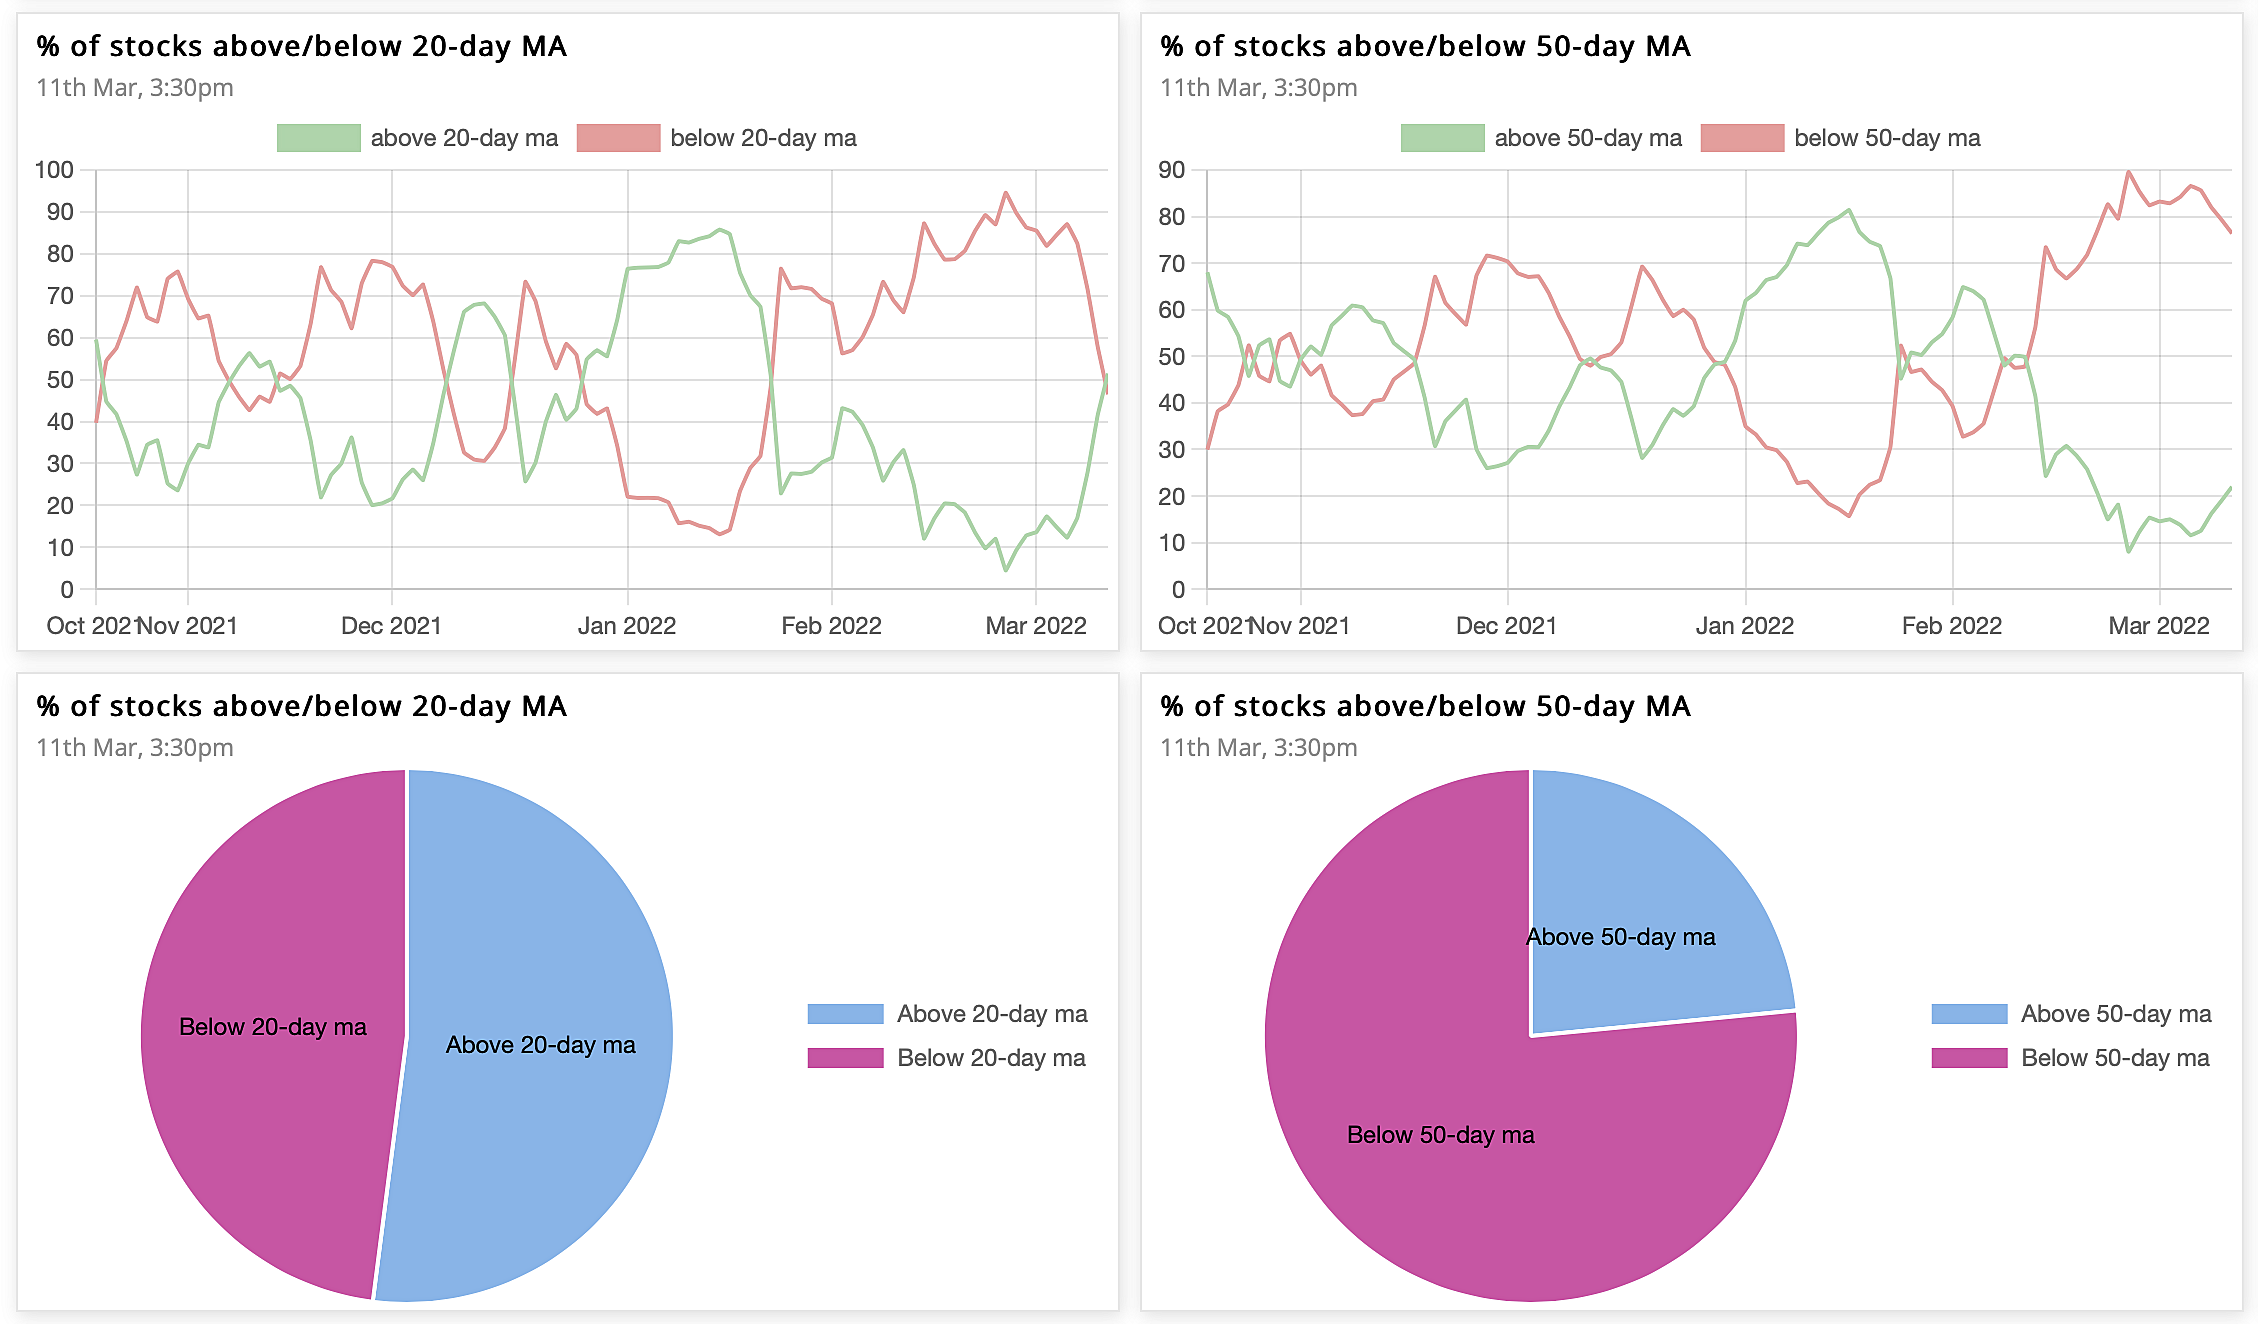
% of stocks above/below 20& 50MA
The Ratio between stocks above & below 50MA is now 0.3, while that for 20MA is 1. The 10-day cumulative ratio for stocks above 50MA is 0.16. A value >2 is good for swing trades on the long side.
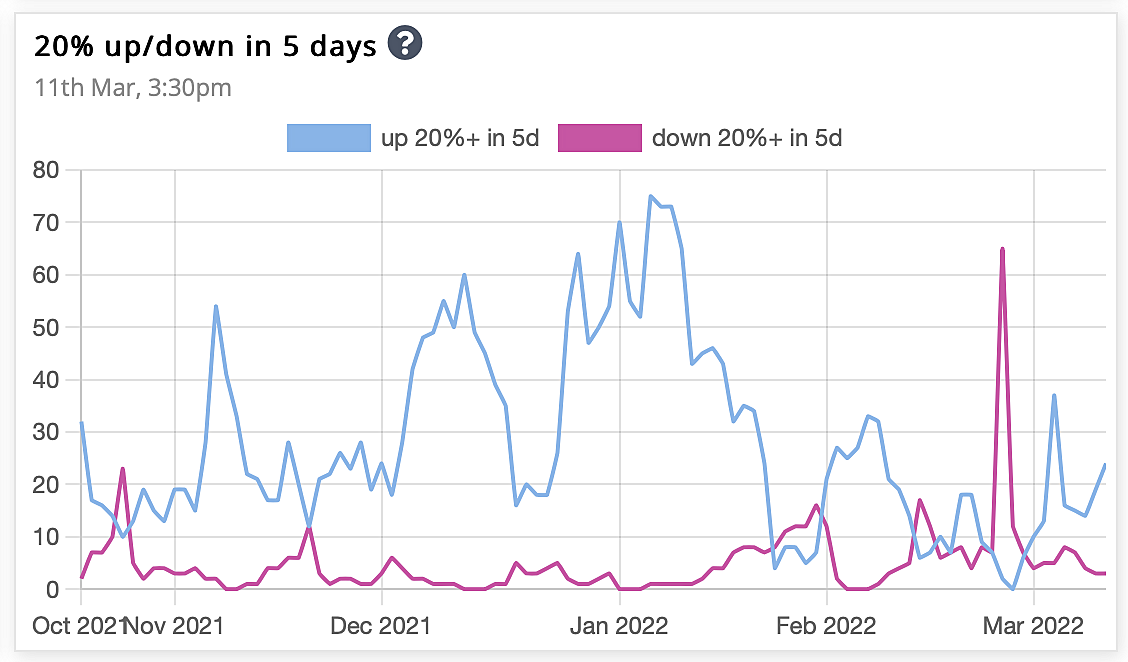
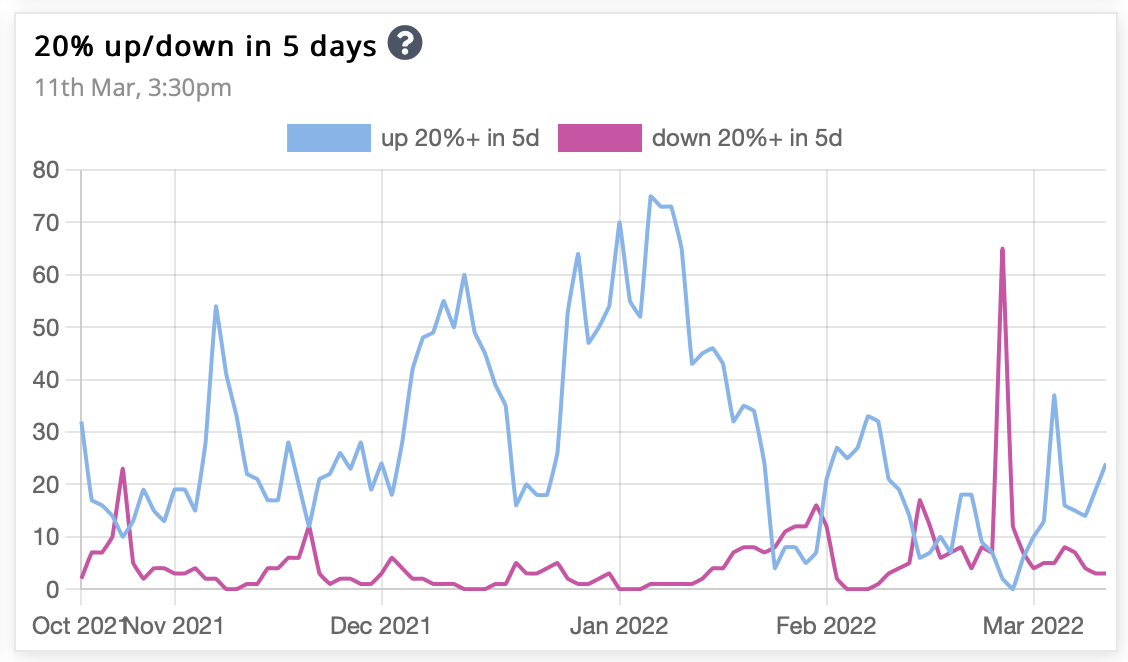
20% up/down in 5 days
The number of stocks up 20% in past 5 days has given brief upswings, but failed to convert into sustained bullish uptrusts. Trading oppurtunites only in the very short-term.
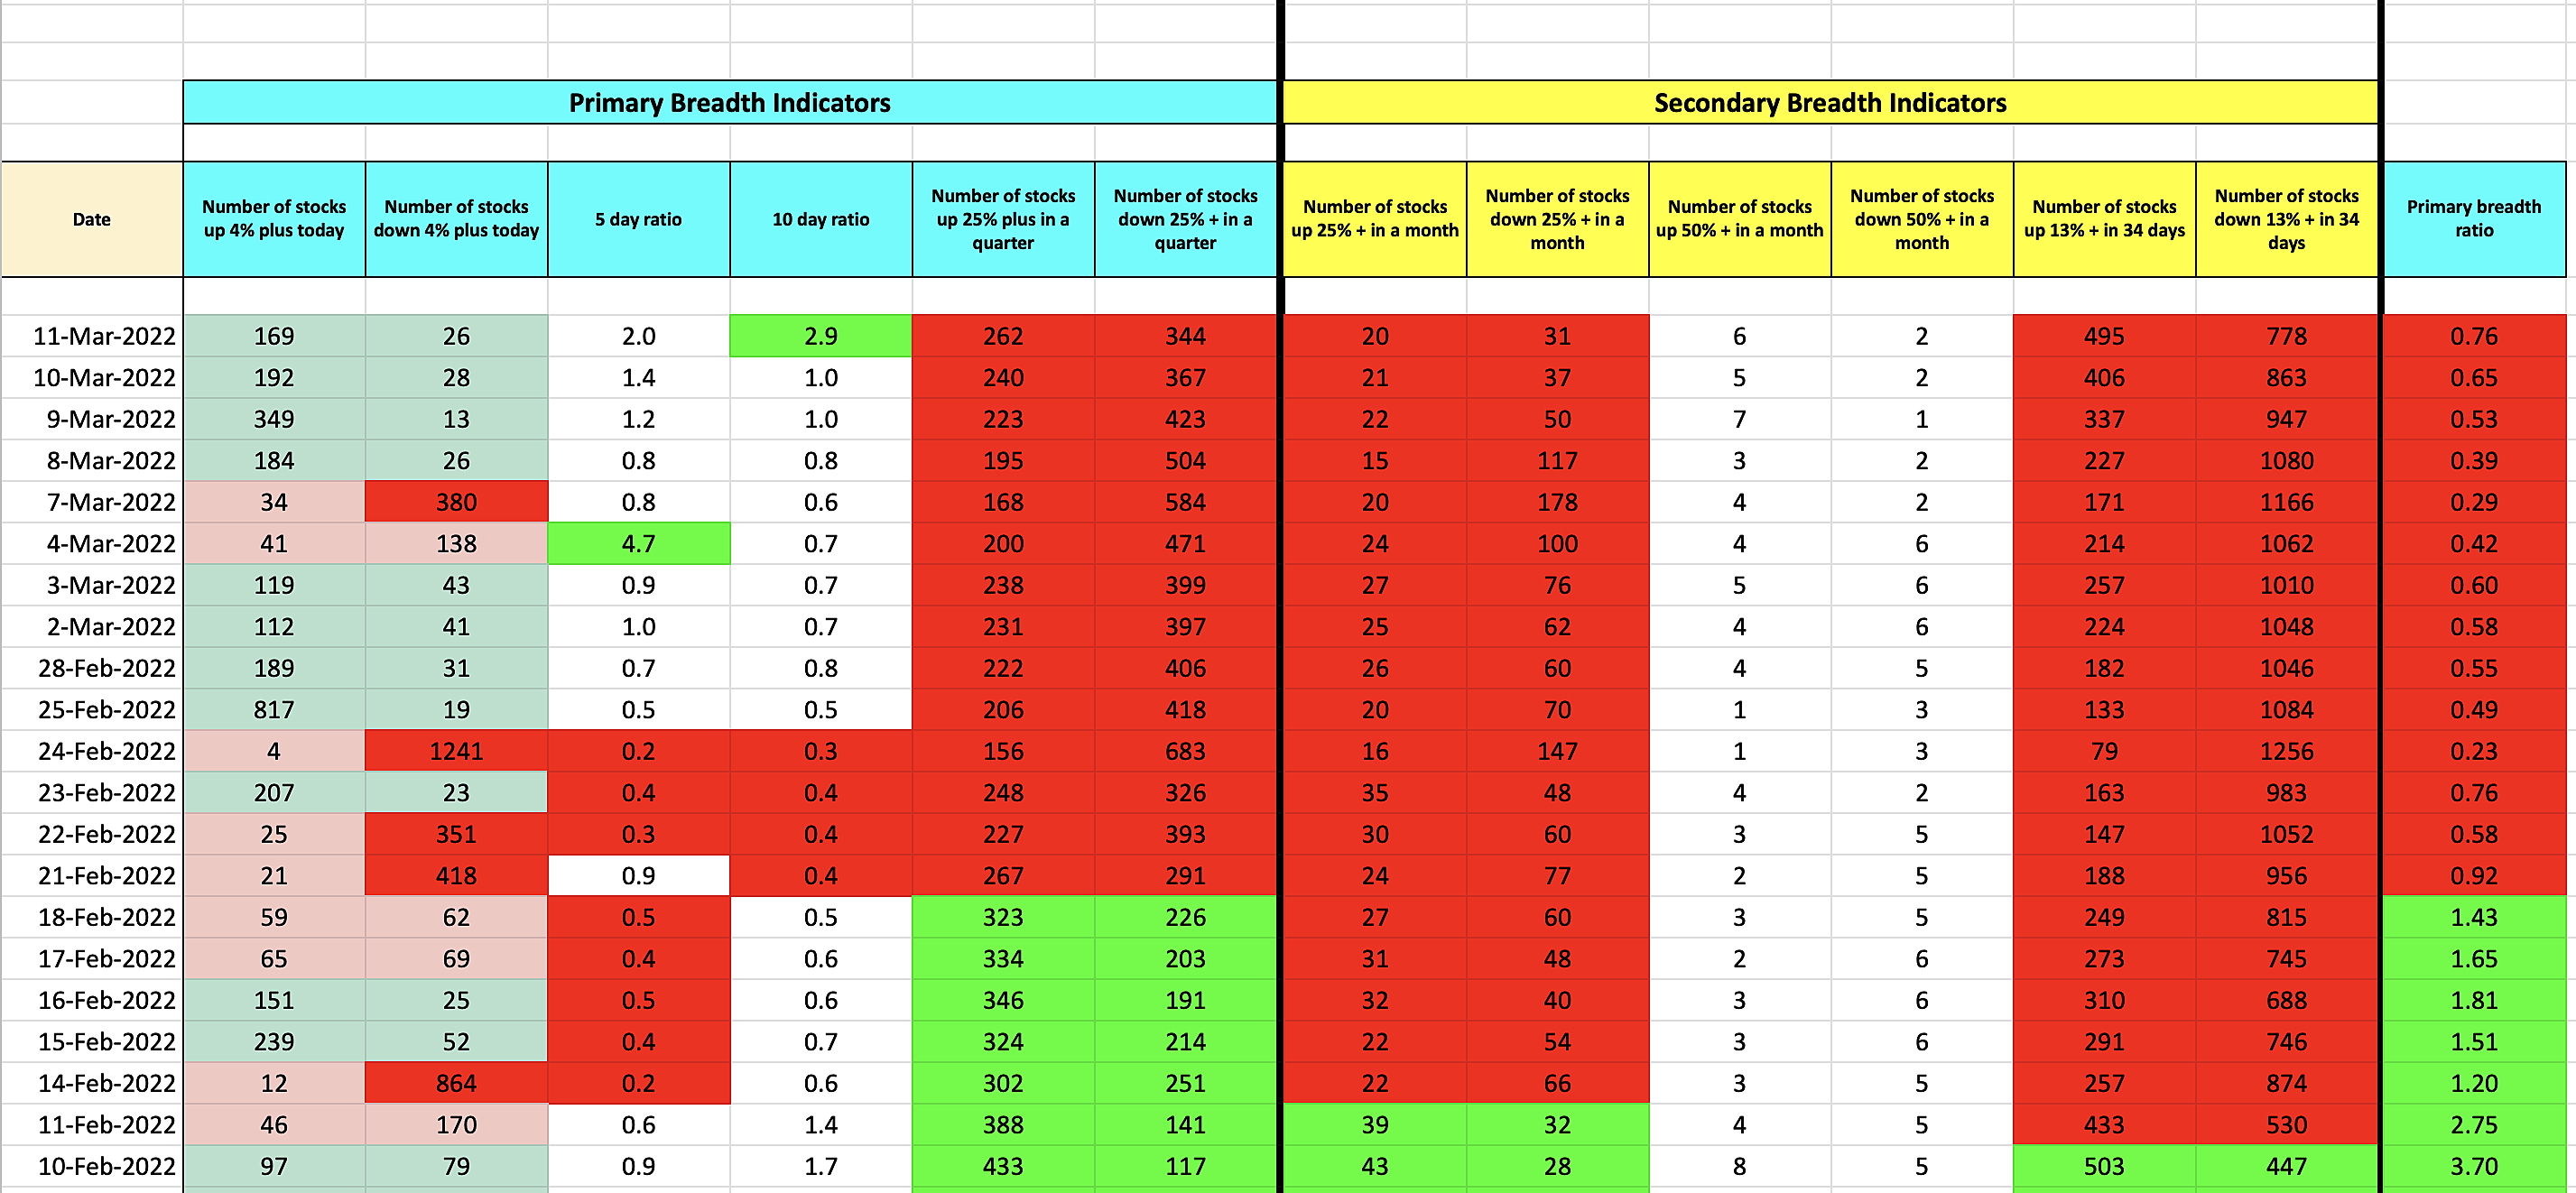
Market Monitor
⦿ On a modified Stockbee market monitor, the bearish phase (both in the long-term & short-term) continues for third consecutive week.
⦿ The 10-day ratio for stocks up 4% plus in a day shows a bullish breadth thrust.
⦿ The number of stocks 25% plus quarter stays less than 25% down quarter.
⦿ Both 13% up in 34 days, & up 25% up in a month have stayed red, which shows bearish phase in the shorter-term as well.
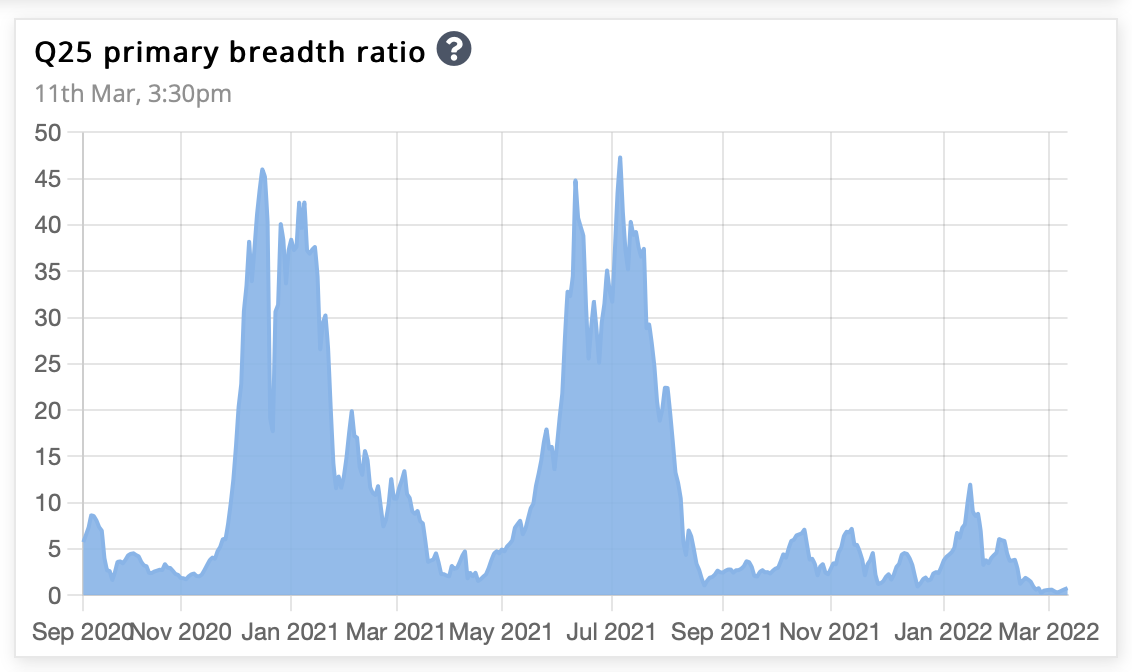
Primary breadth ratio
Overall, the market is bearish, as the number of stocks up 25% plus in a quarter is less than that down 25% plus in a quarter. The ratio between the two is the primary breadth ratio, which is still less than 1.
That’s all for this week. If you'd like to know when I publish something new, just subscribe to my newsletter and you'll get the latest sent direct to you.
.png)
.png?disposition=attachment)