⦿ Bias: Long-term bullish, short-term still bearish
Trend
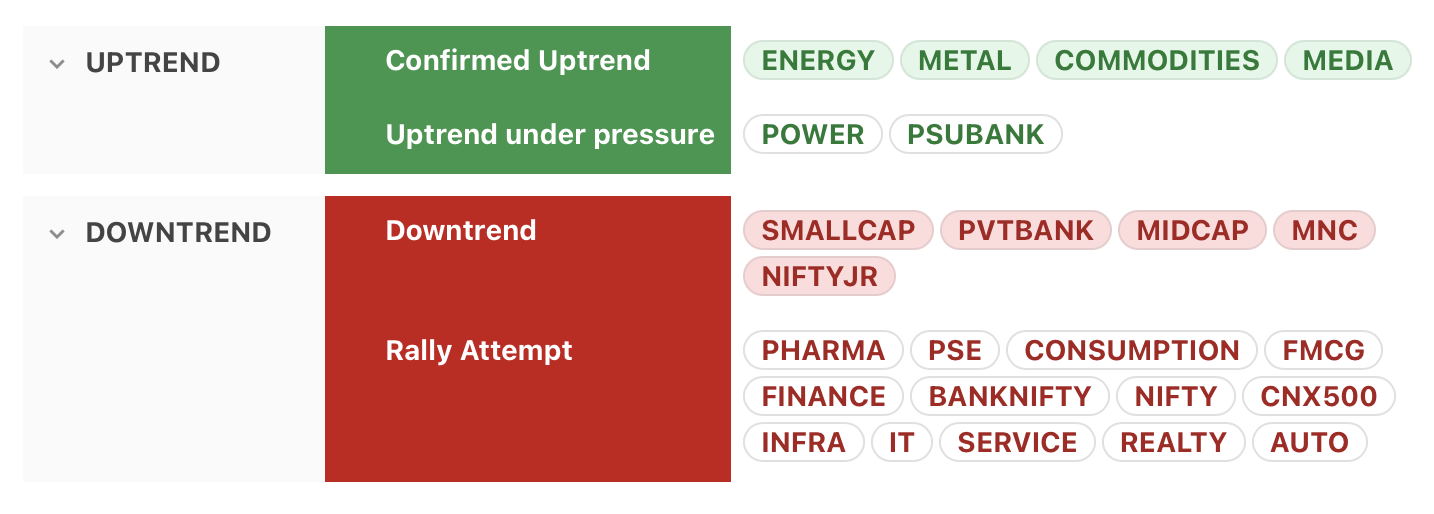
⦿ Most major indices (including Nifty, CNX500, Banknifty) are now in a rally attempt
⦿ Media & Commodities now join Energy & Metal to have confirmed uptrend status
⦿ Smallcap & Midcap pretty close to a rally attempt
Momentum
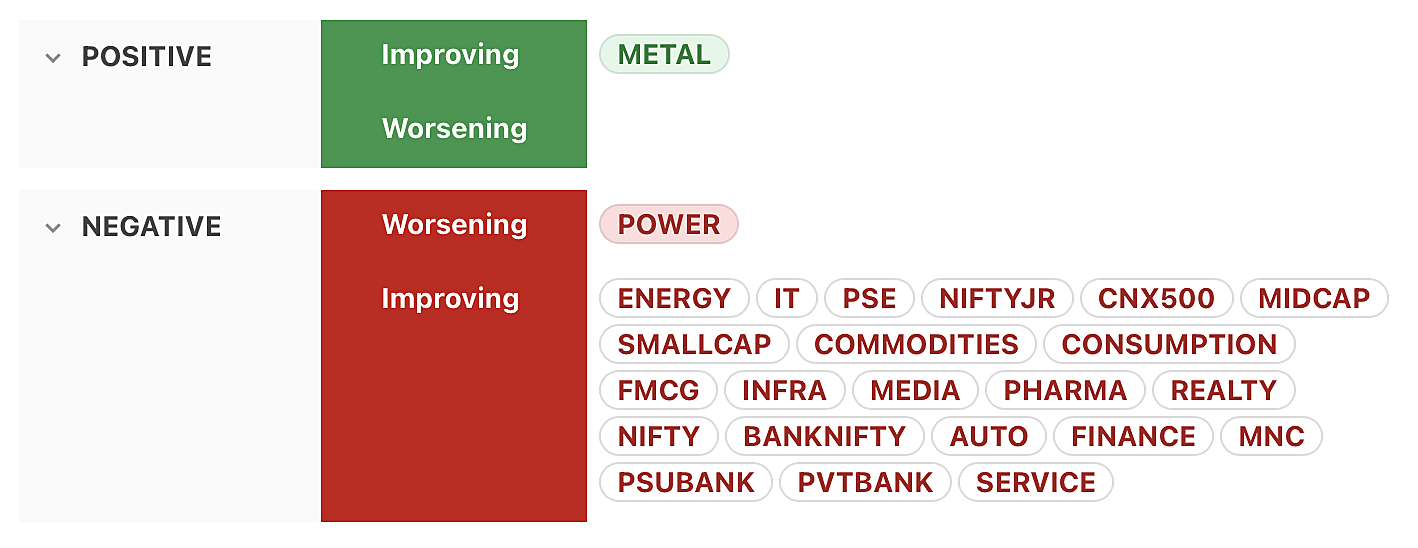
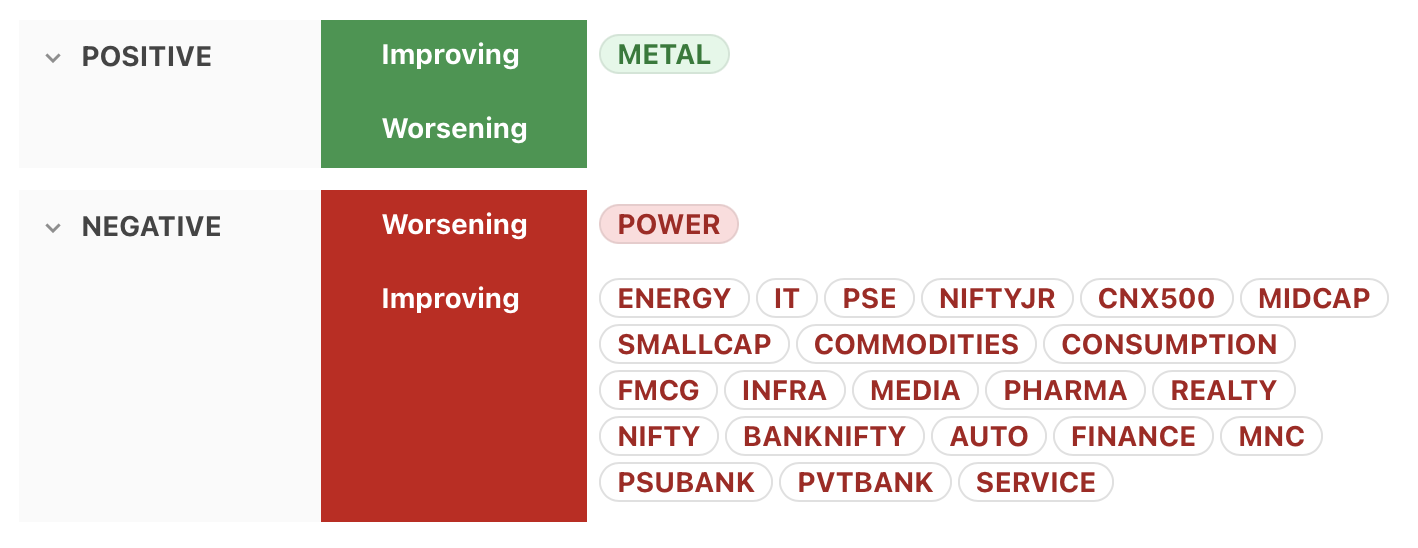
⦿ Metal index still the only one with positive momentum
⦿ Majority of indices (including Nifty, Banknifty, CNX500, Midcap & Smallcap) have negative but improving momentum
Market Breadth
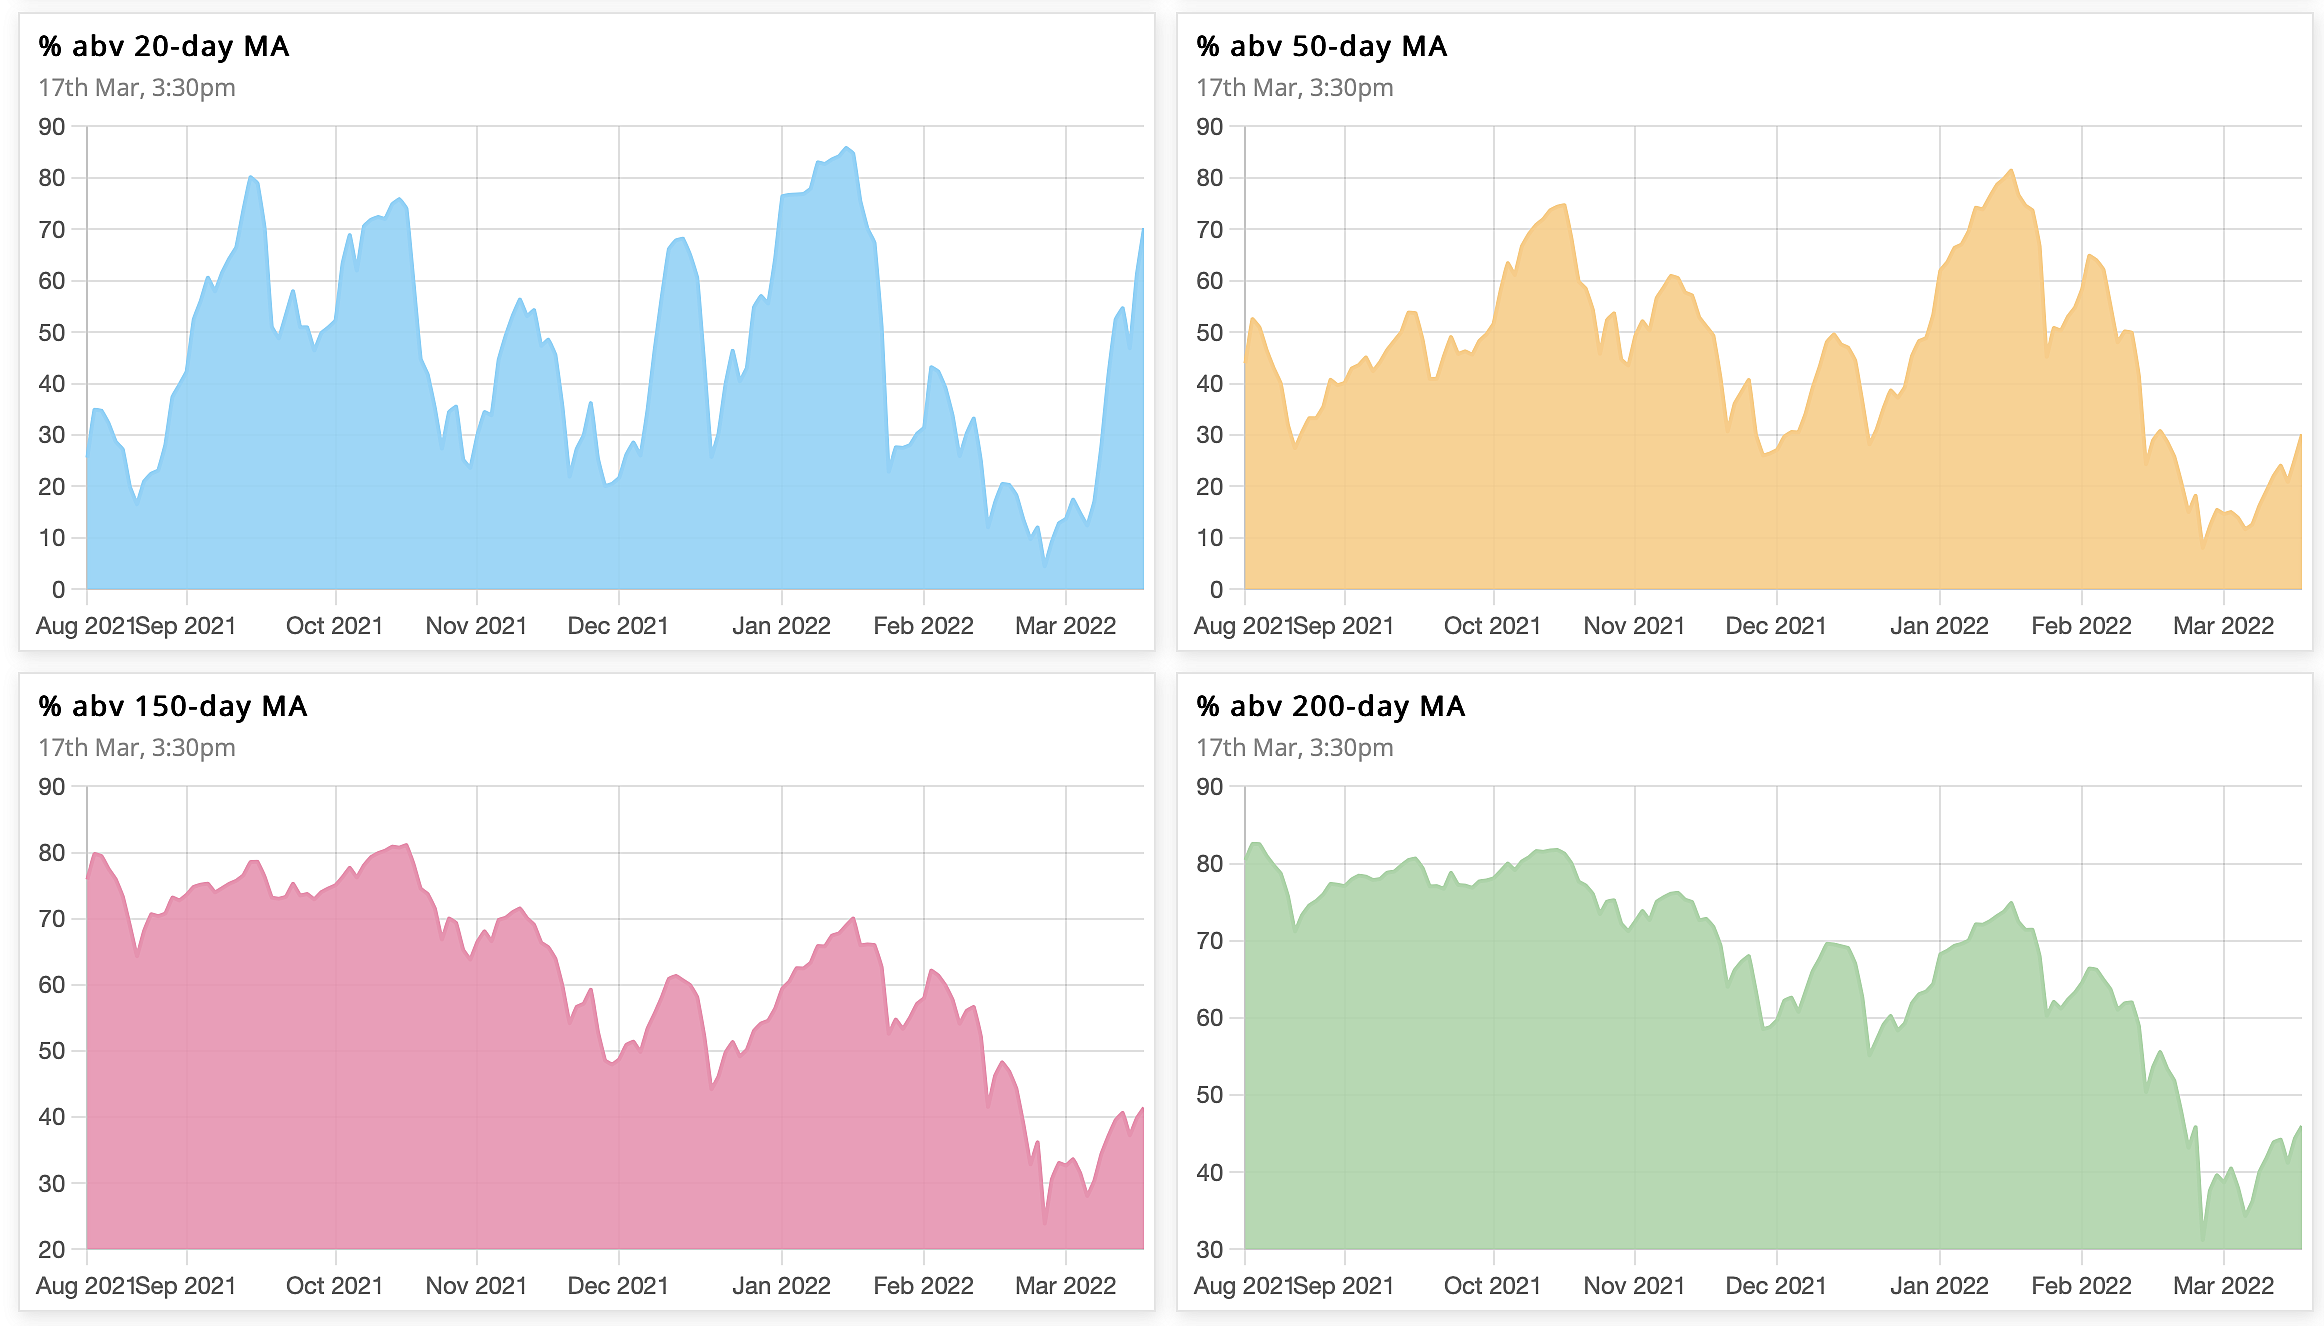
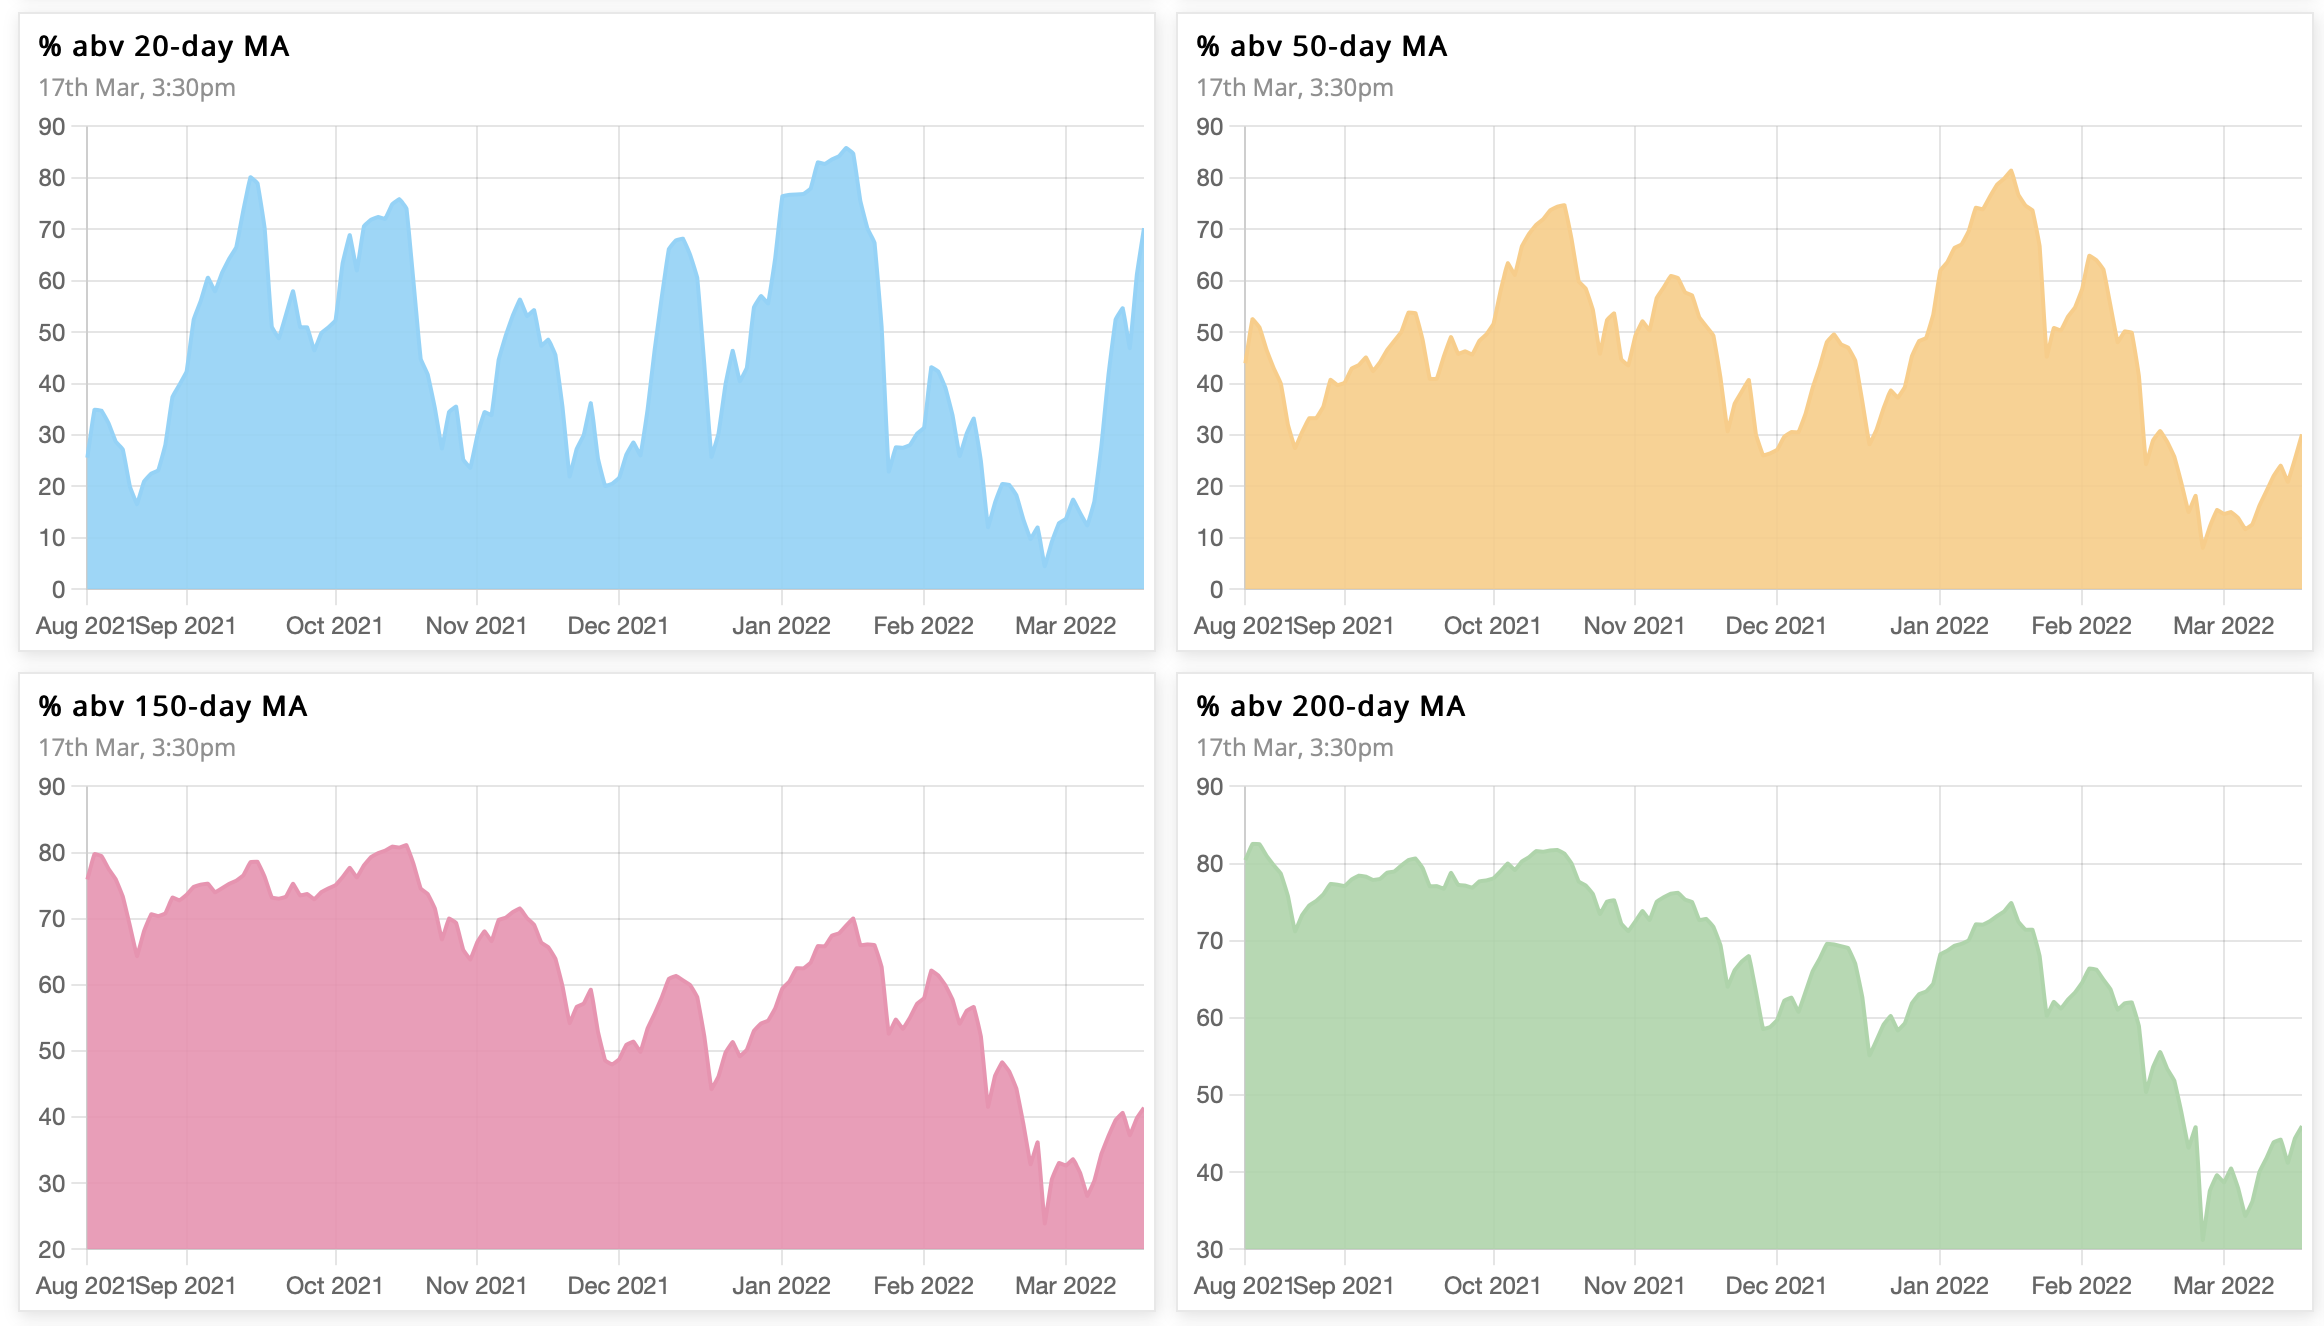
Higher timeframes stay bearish, while very short-term timeframes nearing overbought levels.
⦿ 51% → 70% above 20 MA (near overbought)
⦿ 21% → 30% above 50 MA (neutral)
⦿ 38% → 41% above 150 MA (bearish bias)
⦿ 42% → 45% above 200 MA (bearish bias)
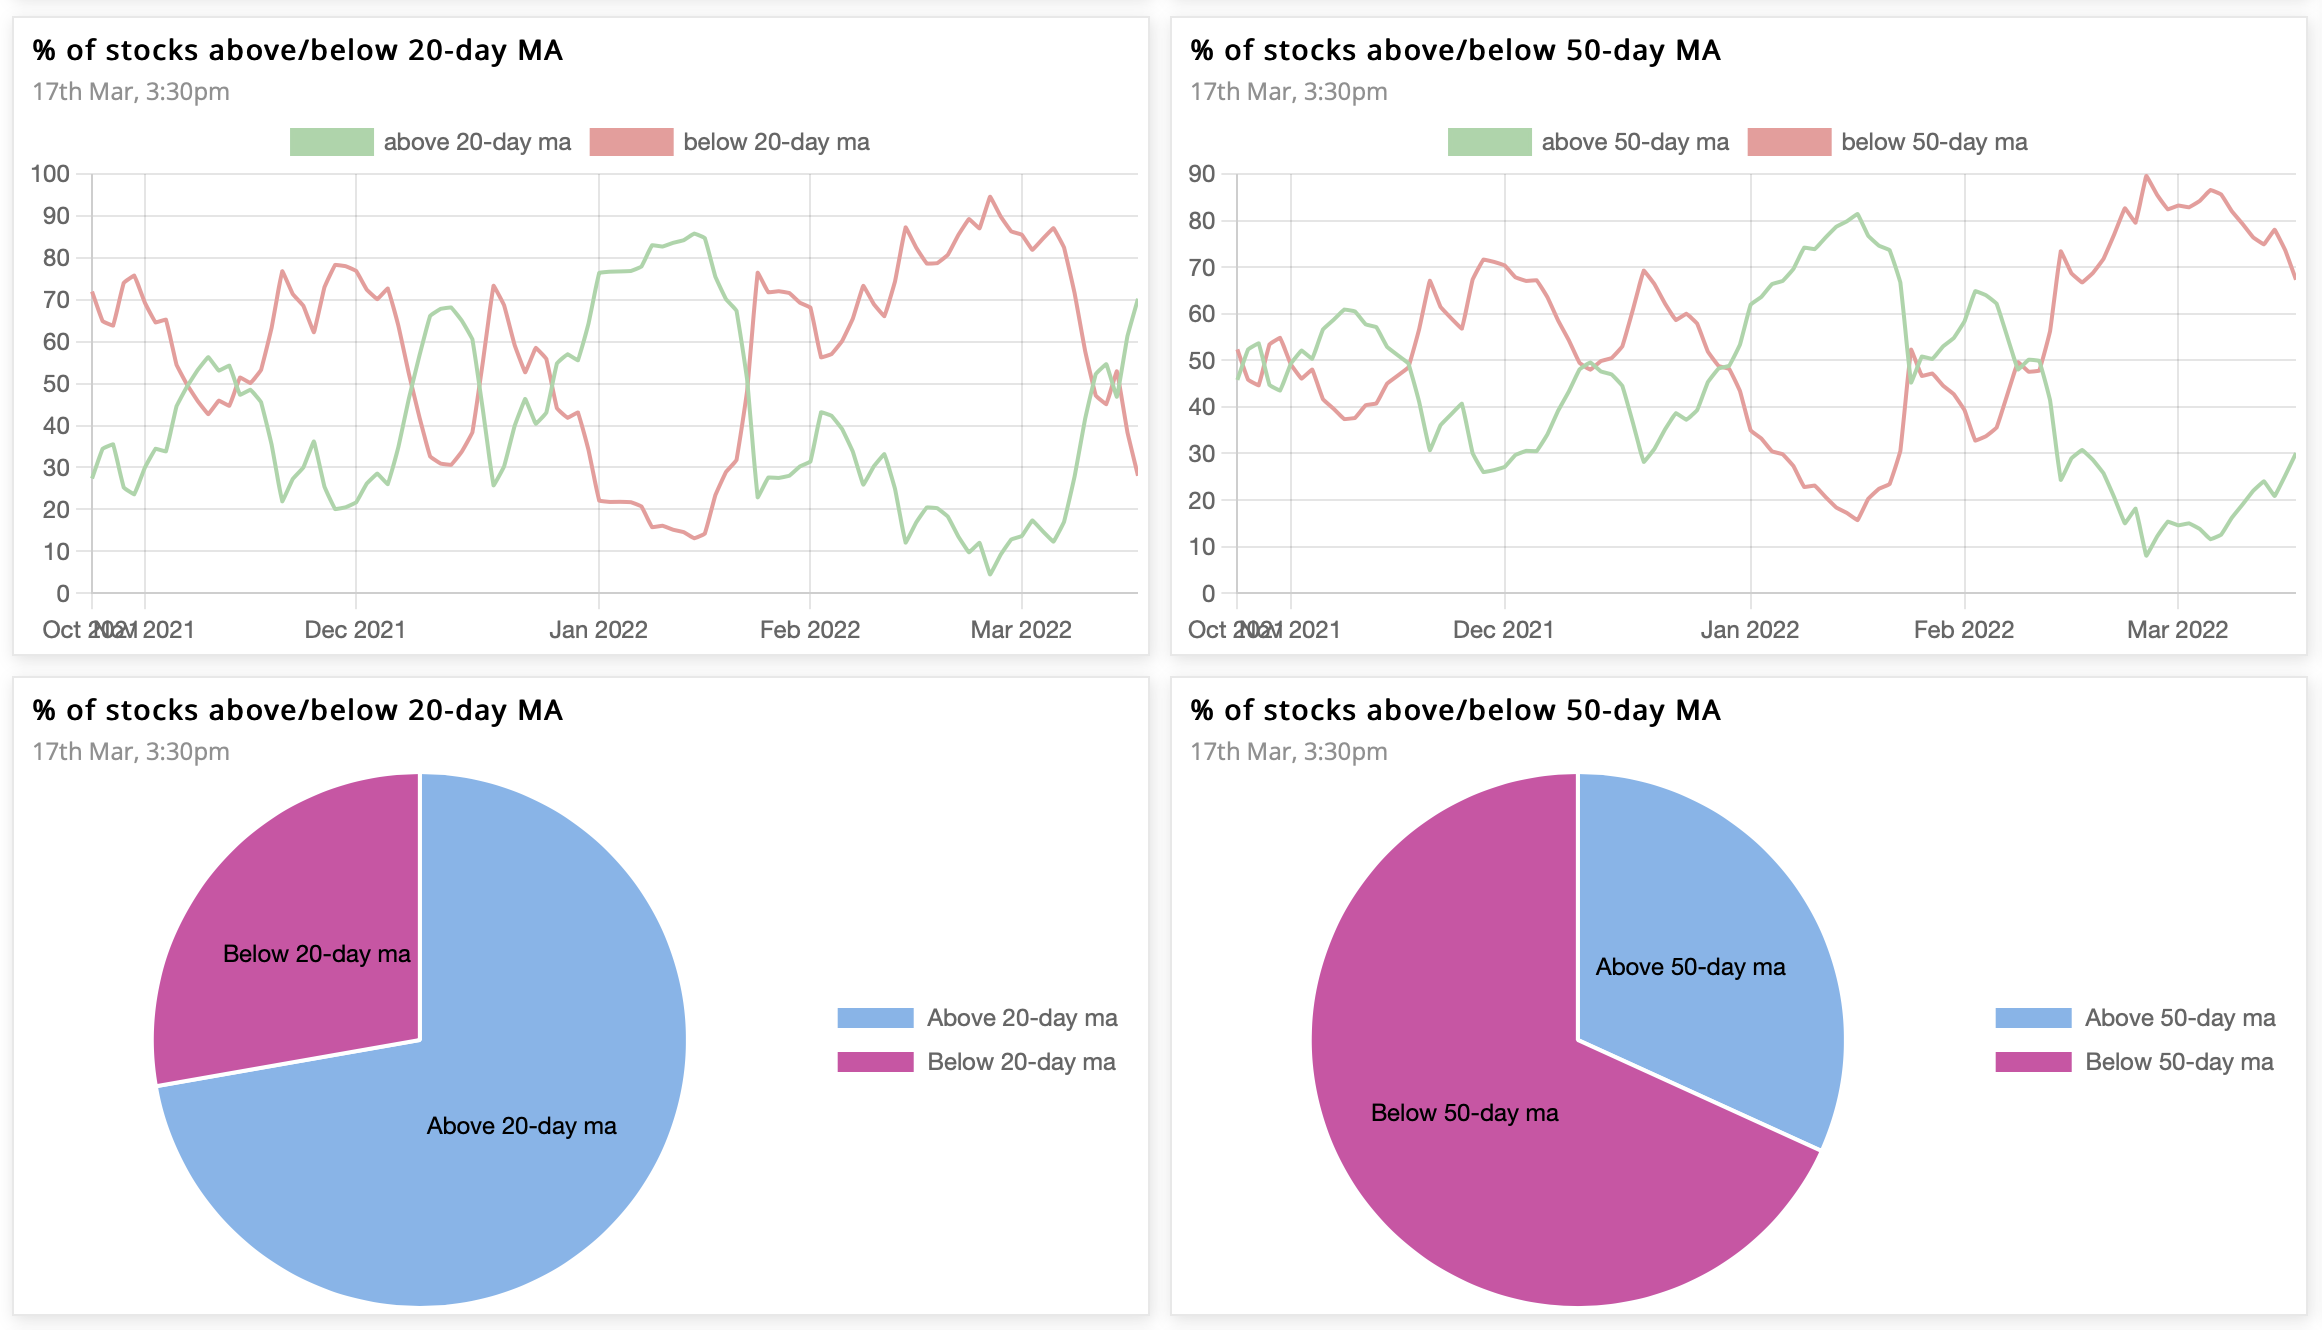
% of stocks above/below 20-MA & 50-MA
The Ratio between stocks above & below 50MA is 0.4, while that for 20MA is 2.6. The 10-day cumulative ratio for stocks above 50MA is 0.2. A value >2 is good for swing trades on the long side.
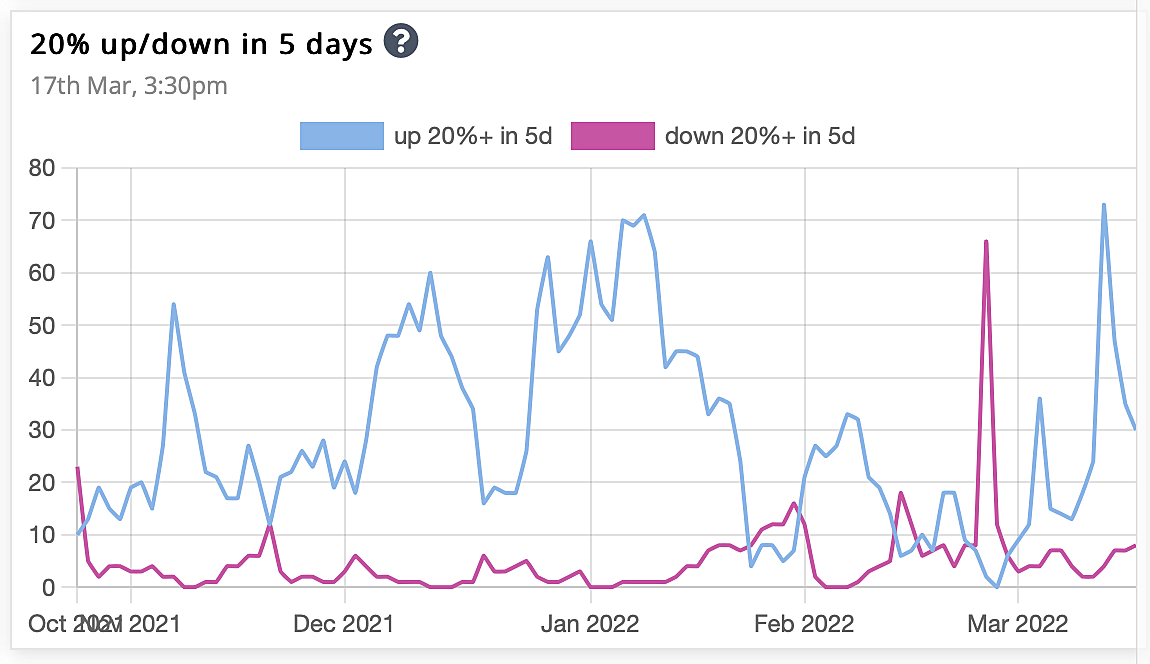
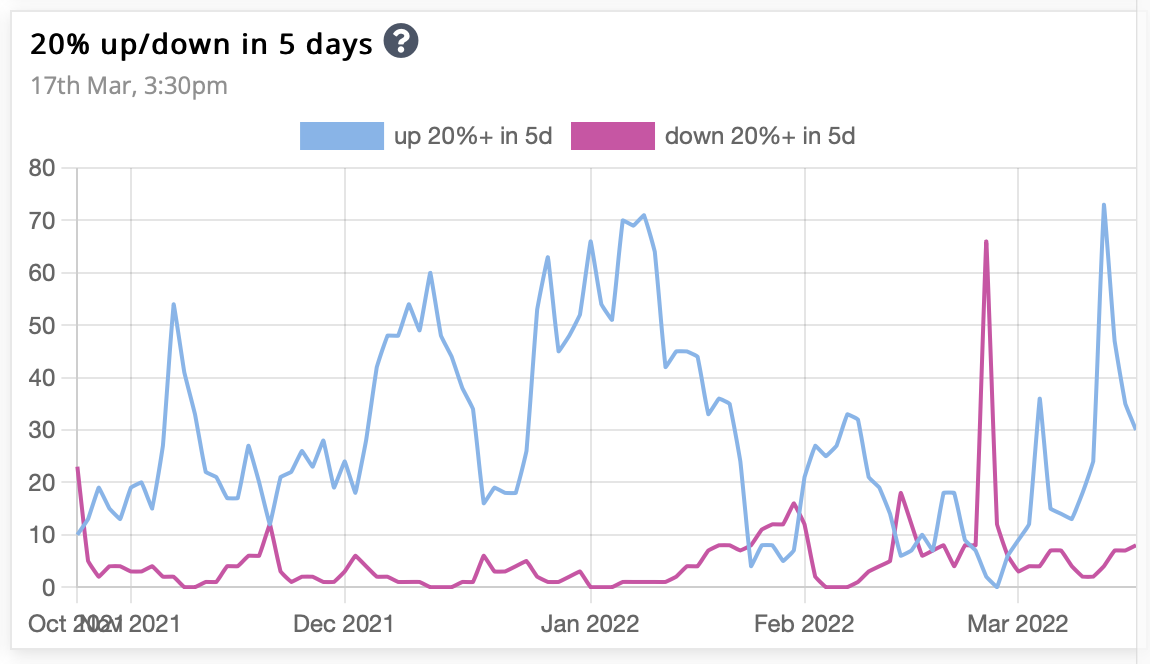
20% up/down in 5 days
The number of stocks up 20% in past 5 days gave a bullish upthrust this week, that didn't sustain.
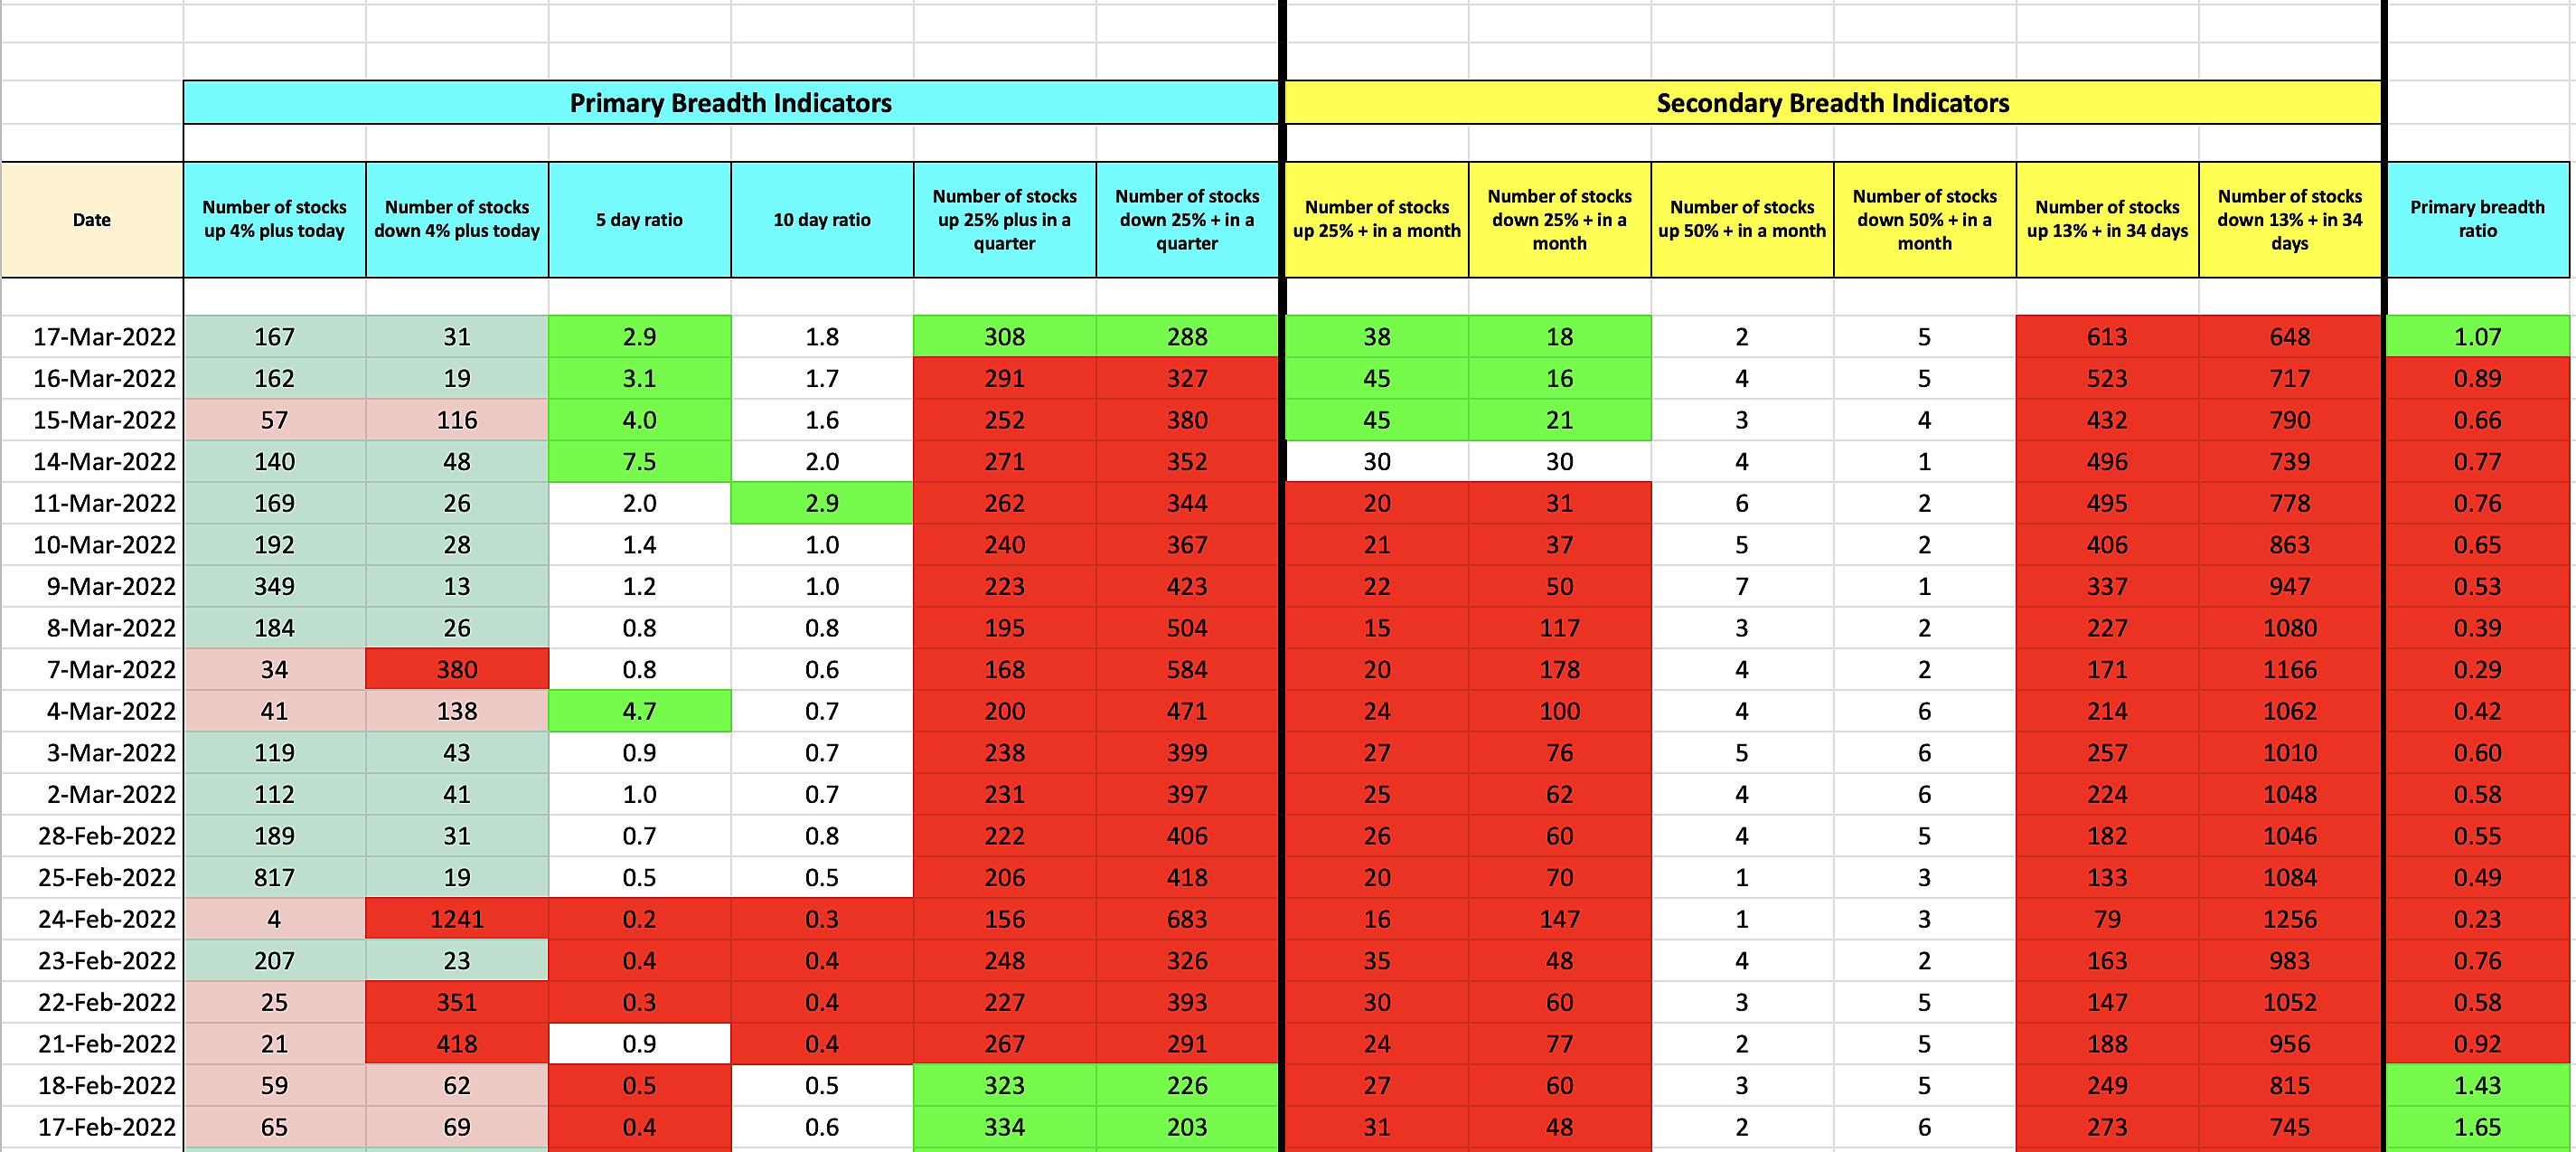
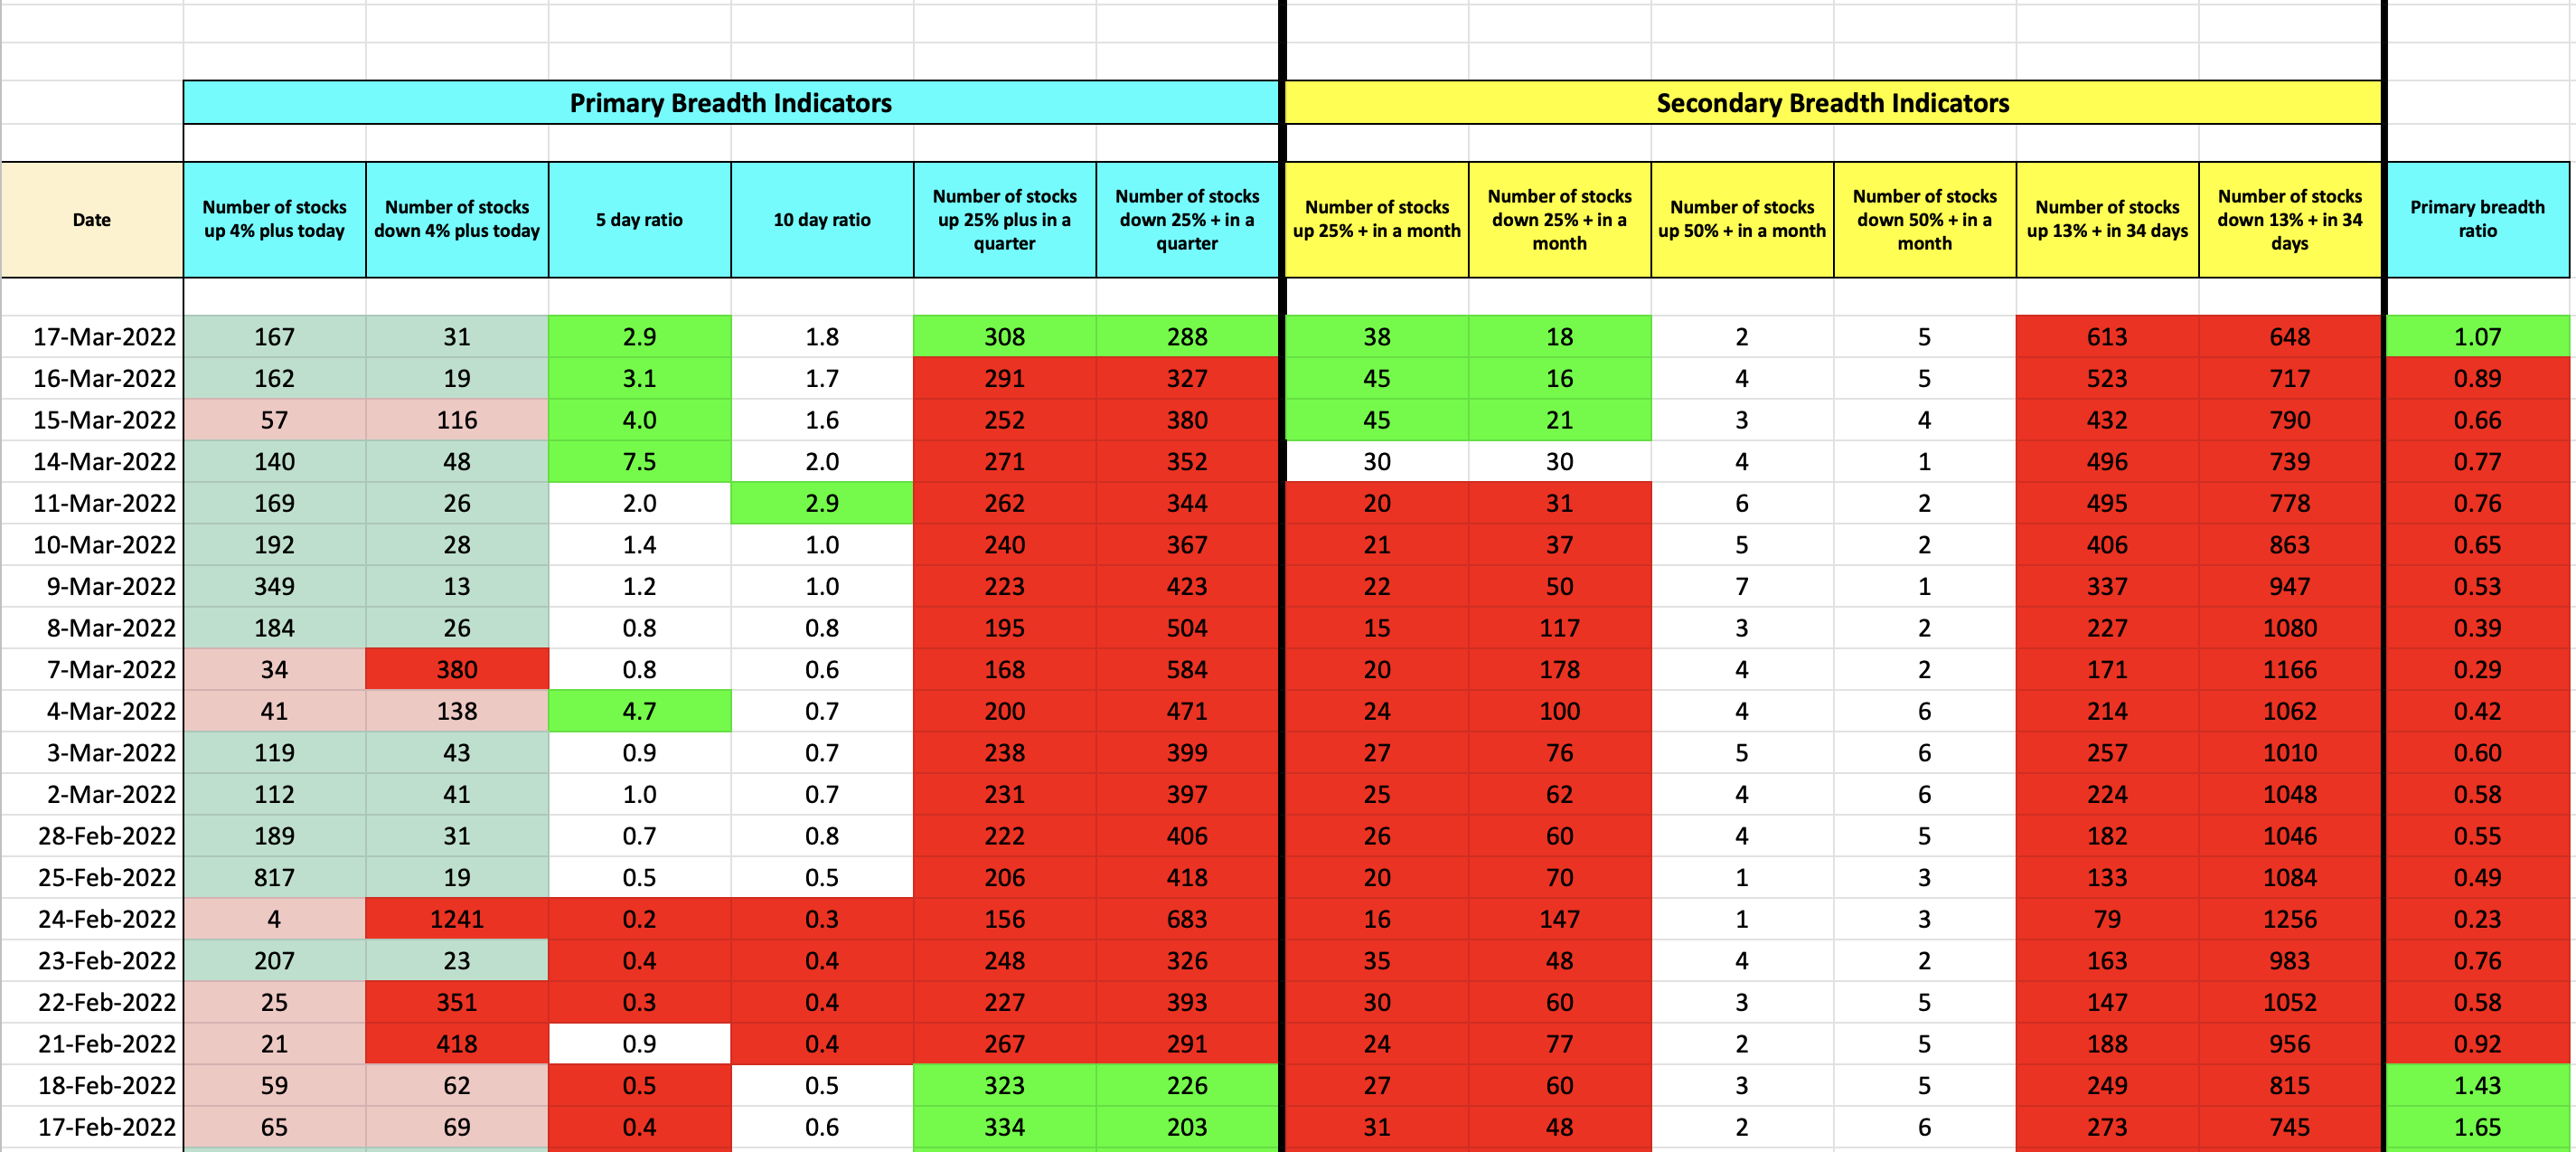
Stockbee Market Monitor
On a modified Stockbee market monitor, the short-term bearish phase (13% up in 34 days) continues for fourth consecutive week, but the long-term metric of stocks 25% plus quarter is now back in the green.
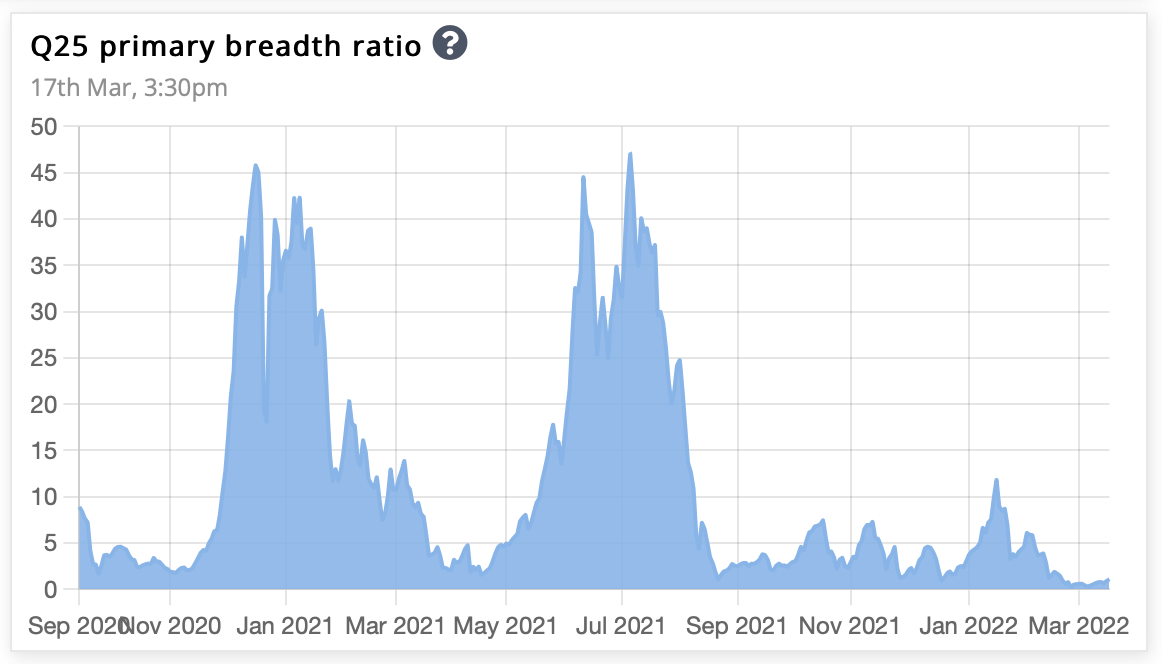
Primary Breadth Ratio
Overall, the market is bullish, as the number of stocks up 25% plus in a quarter is now greater than that down 25% plus in a quarter. The ratio between the two is the primary breadth ratio, which is now greater than 1.
That’s all for this week. If you'd like to know when I publish something new, just subscribe to my newsletter and you'll get the latest sent direct to you.
.png)
.png?disposition=attachment)