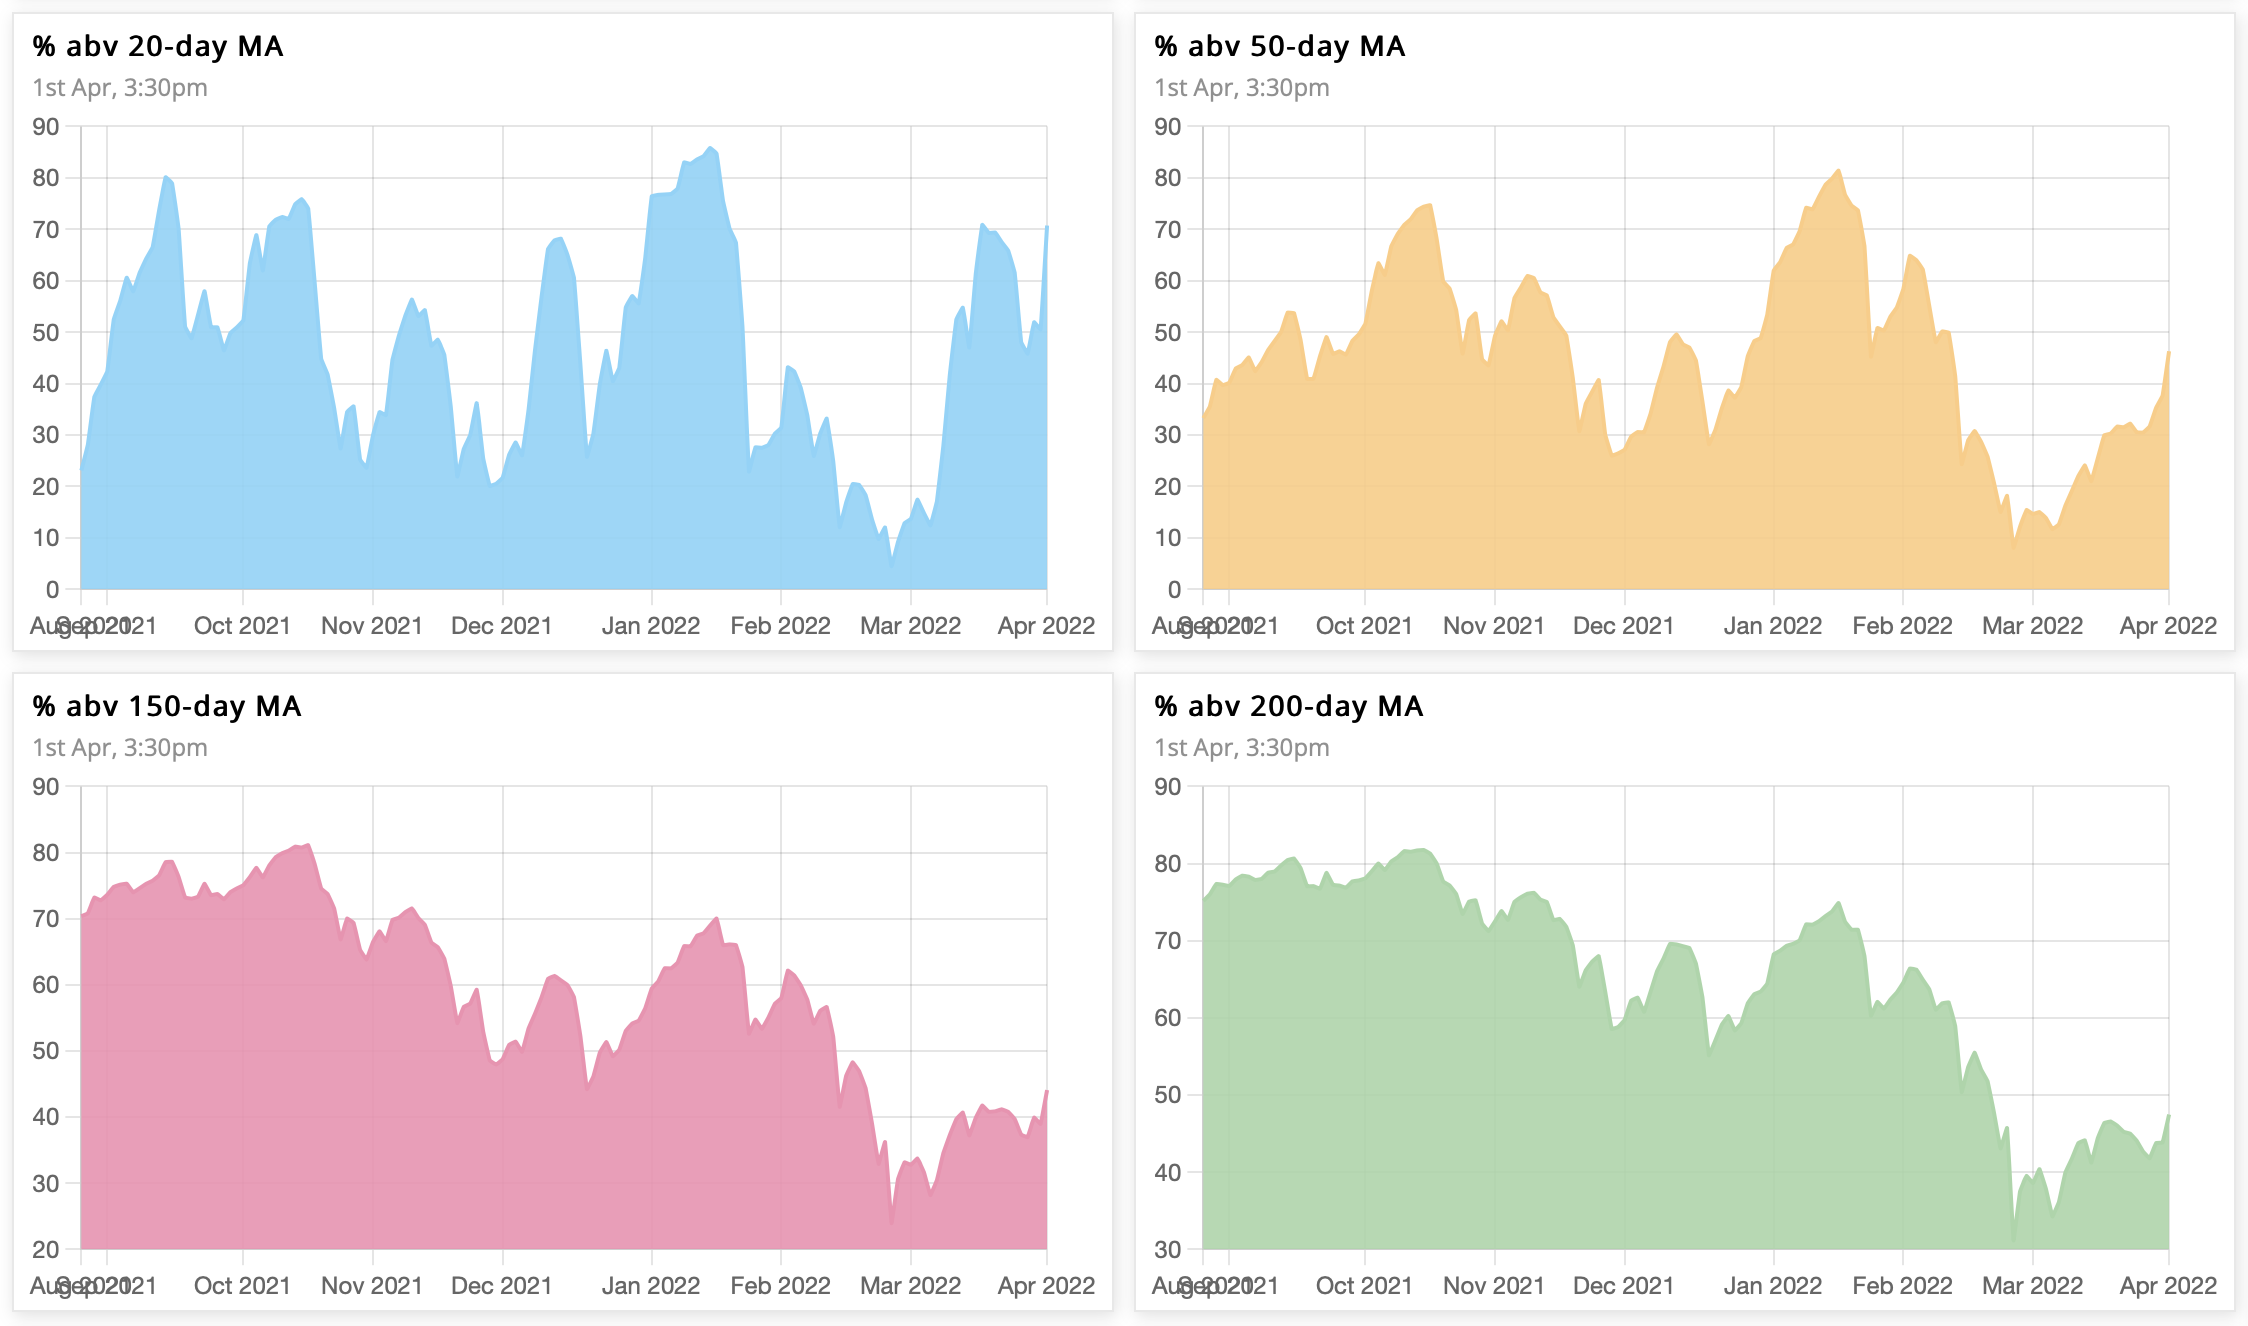
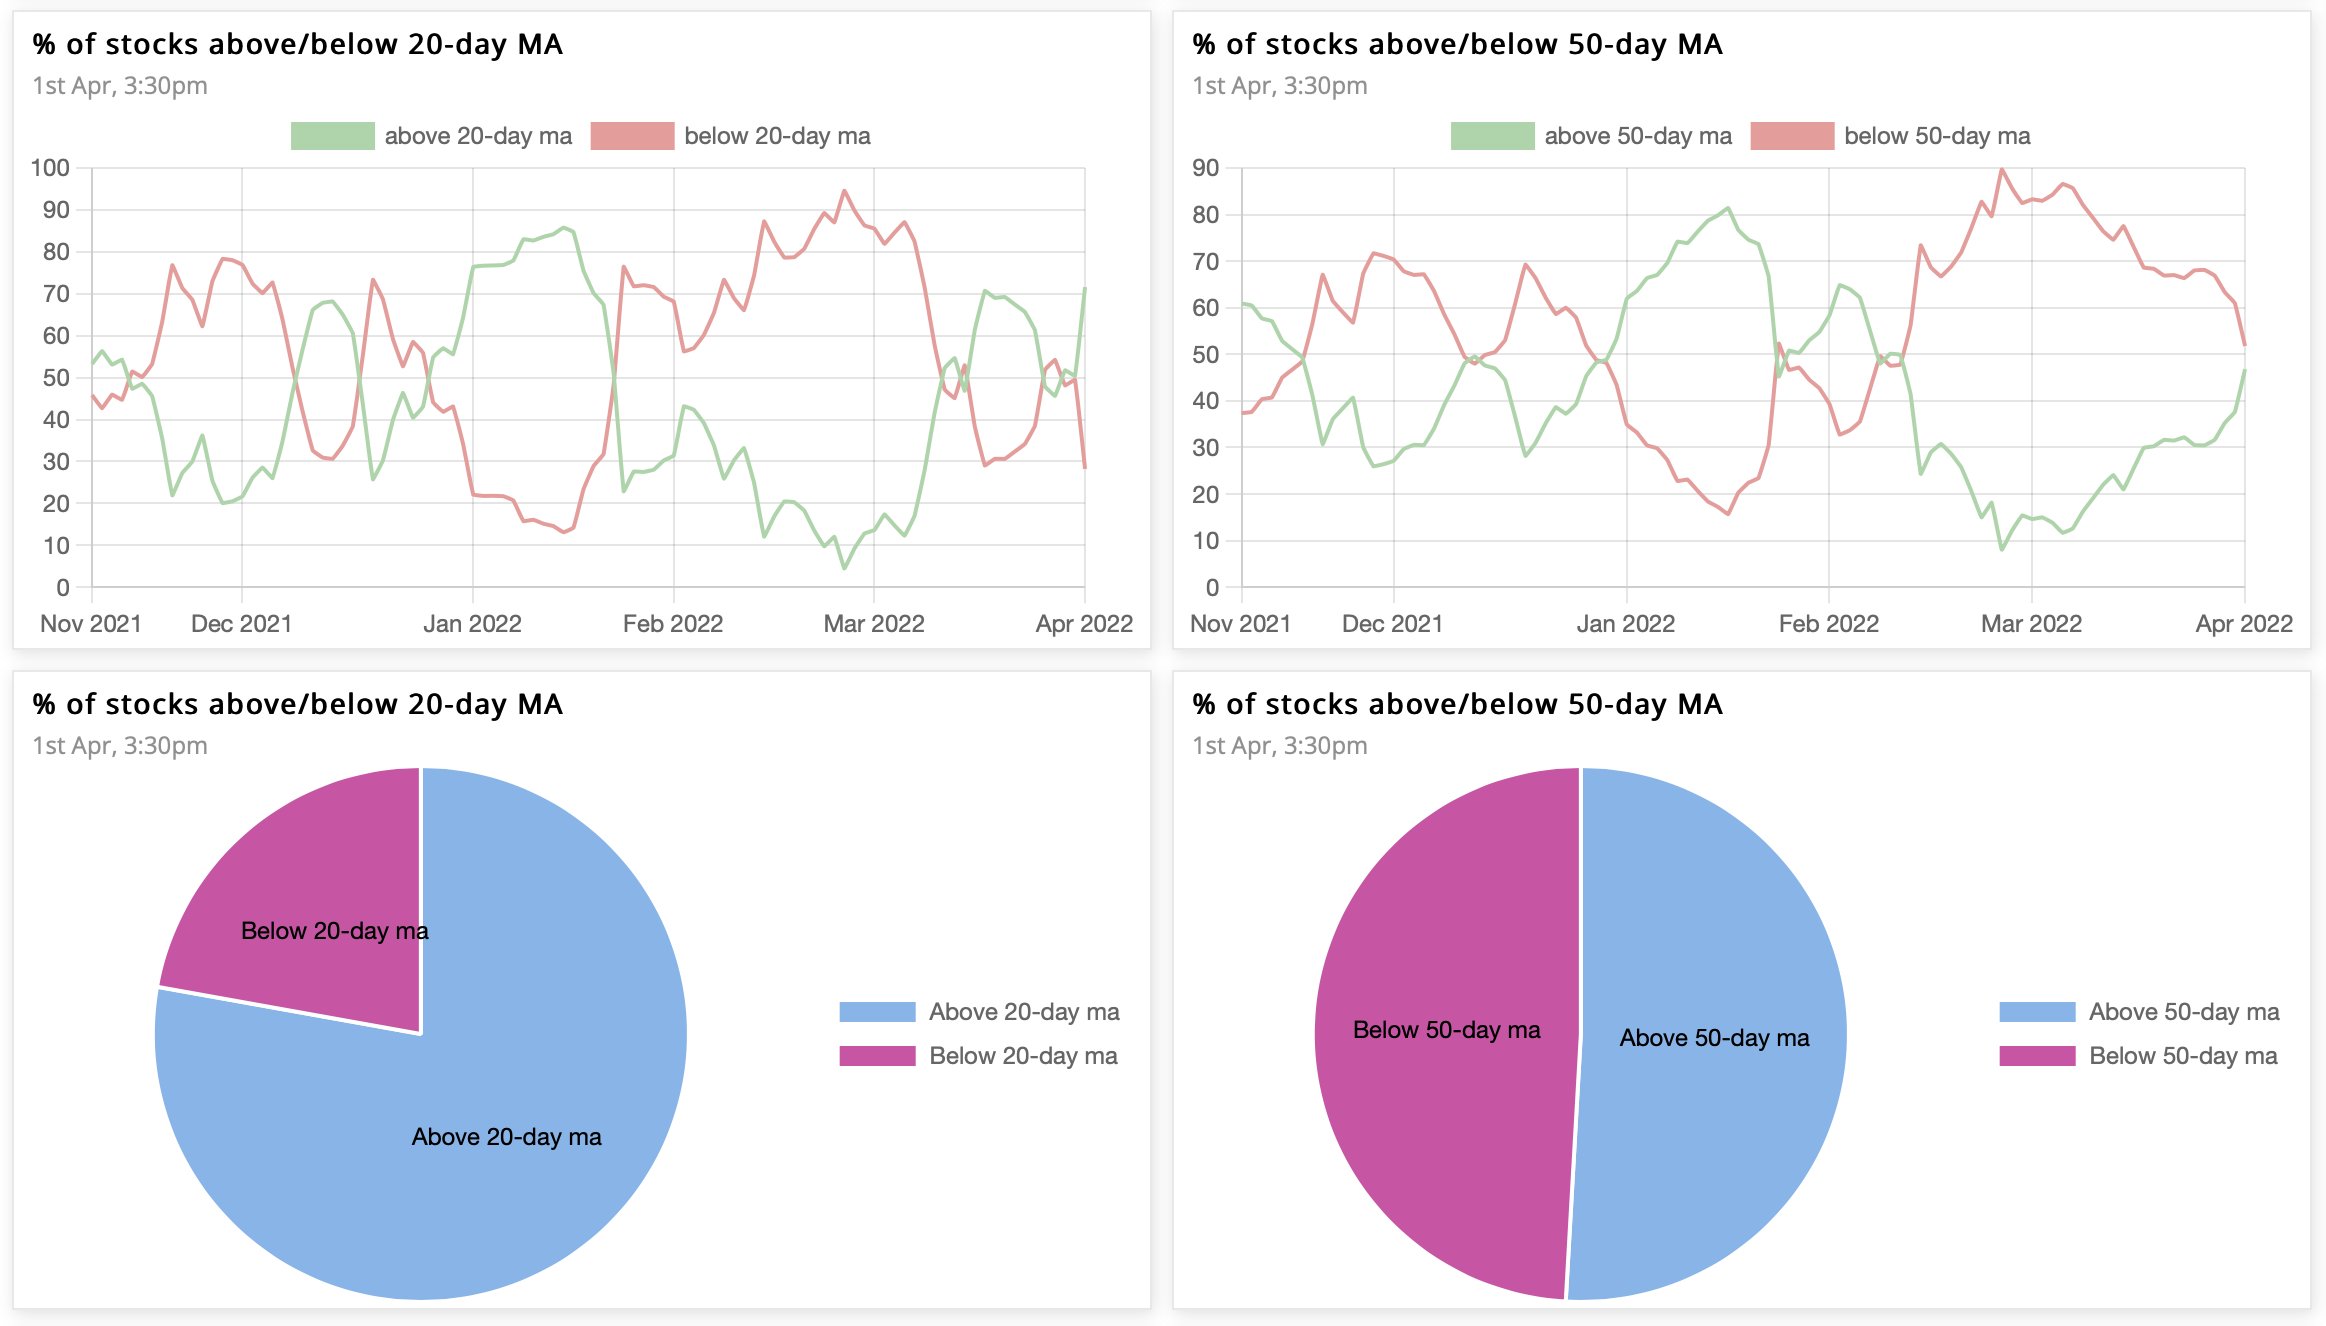
The Ratio between stocks above & below 50MA is 1.0, while that for 20MA is 3.5. The 10-day cumulative ratio for stocks above 50MA is 0.4. A value >2 is good for swing trades on the long side.
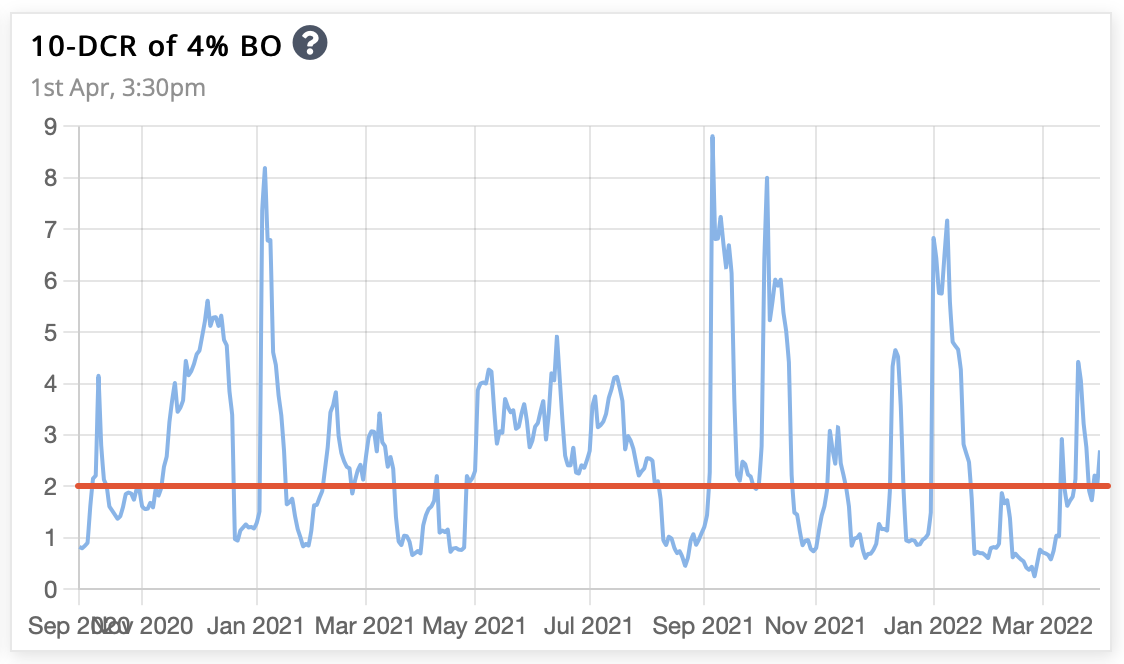
4% up/down in 1 day
The 10-day cumulative ratio between stocks up & down 4% in a day stays in the green (>2), signalling that short-term trading oppurtunites are there.
When market is in bearish phase, a fresh bull move starts when 10-DCR first time above 2.
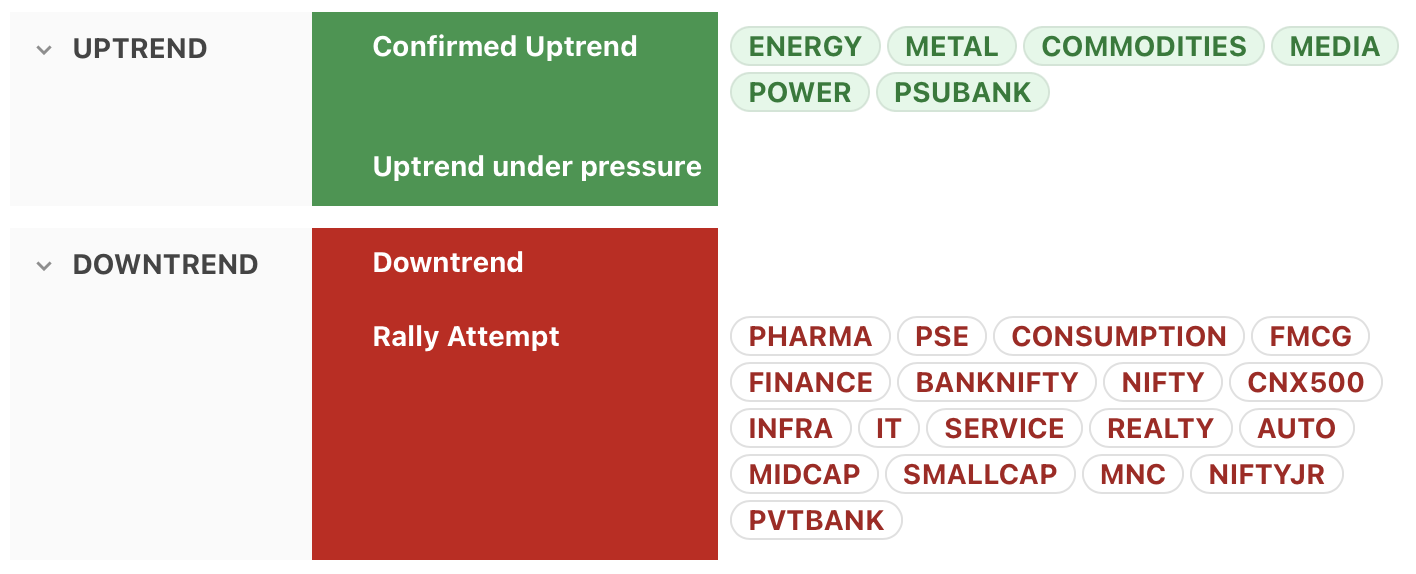
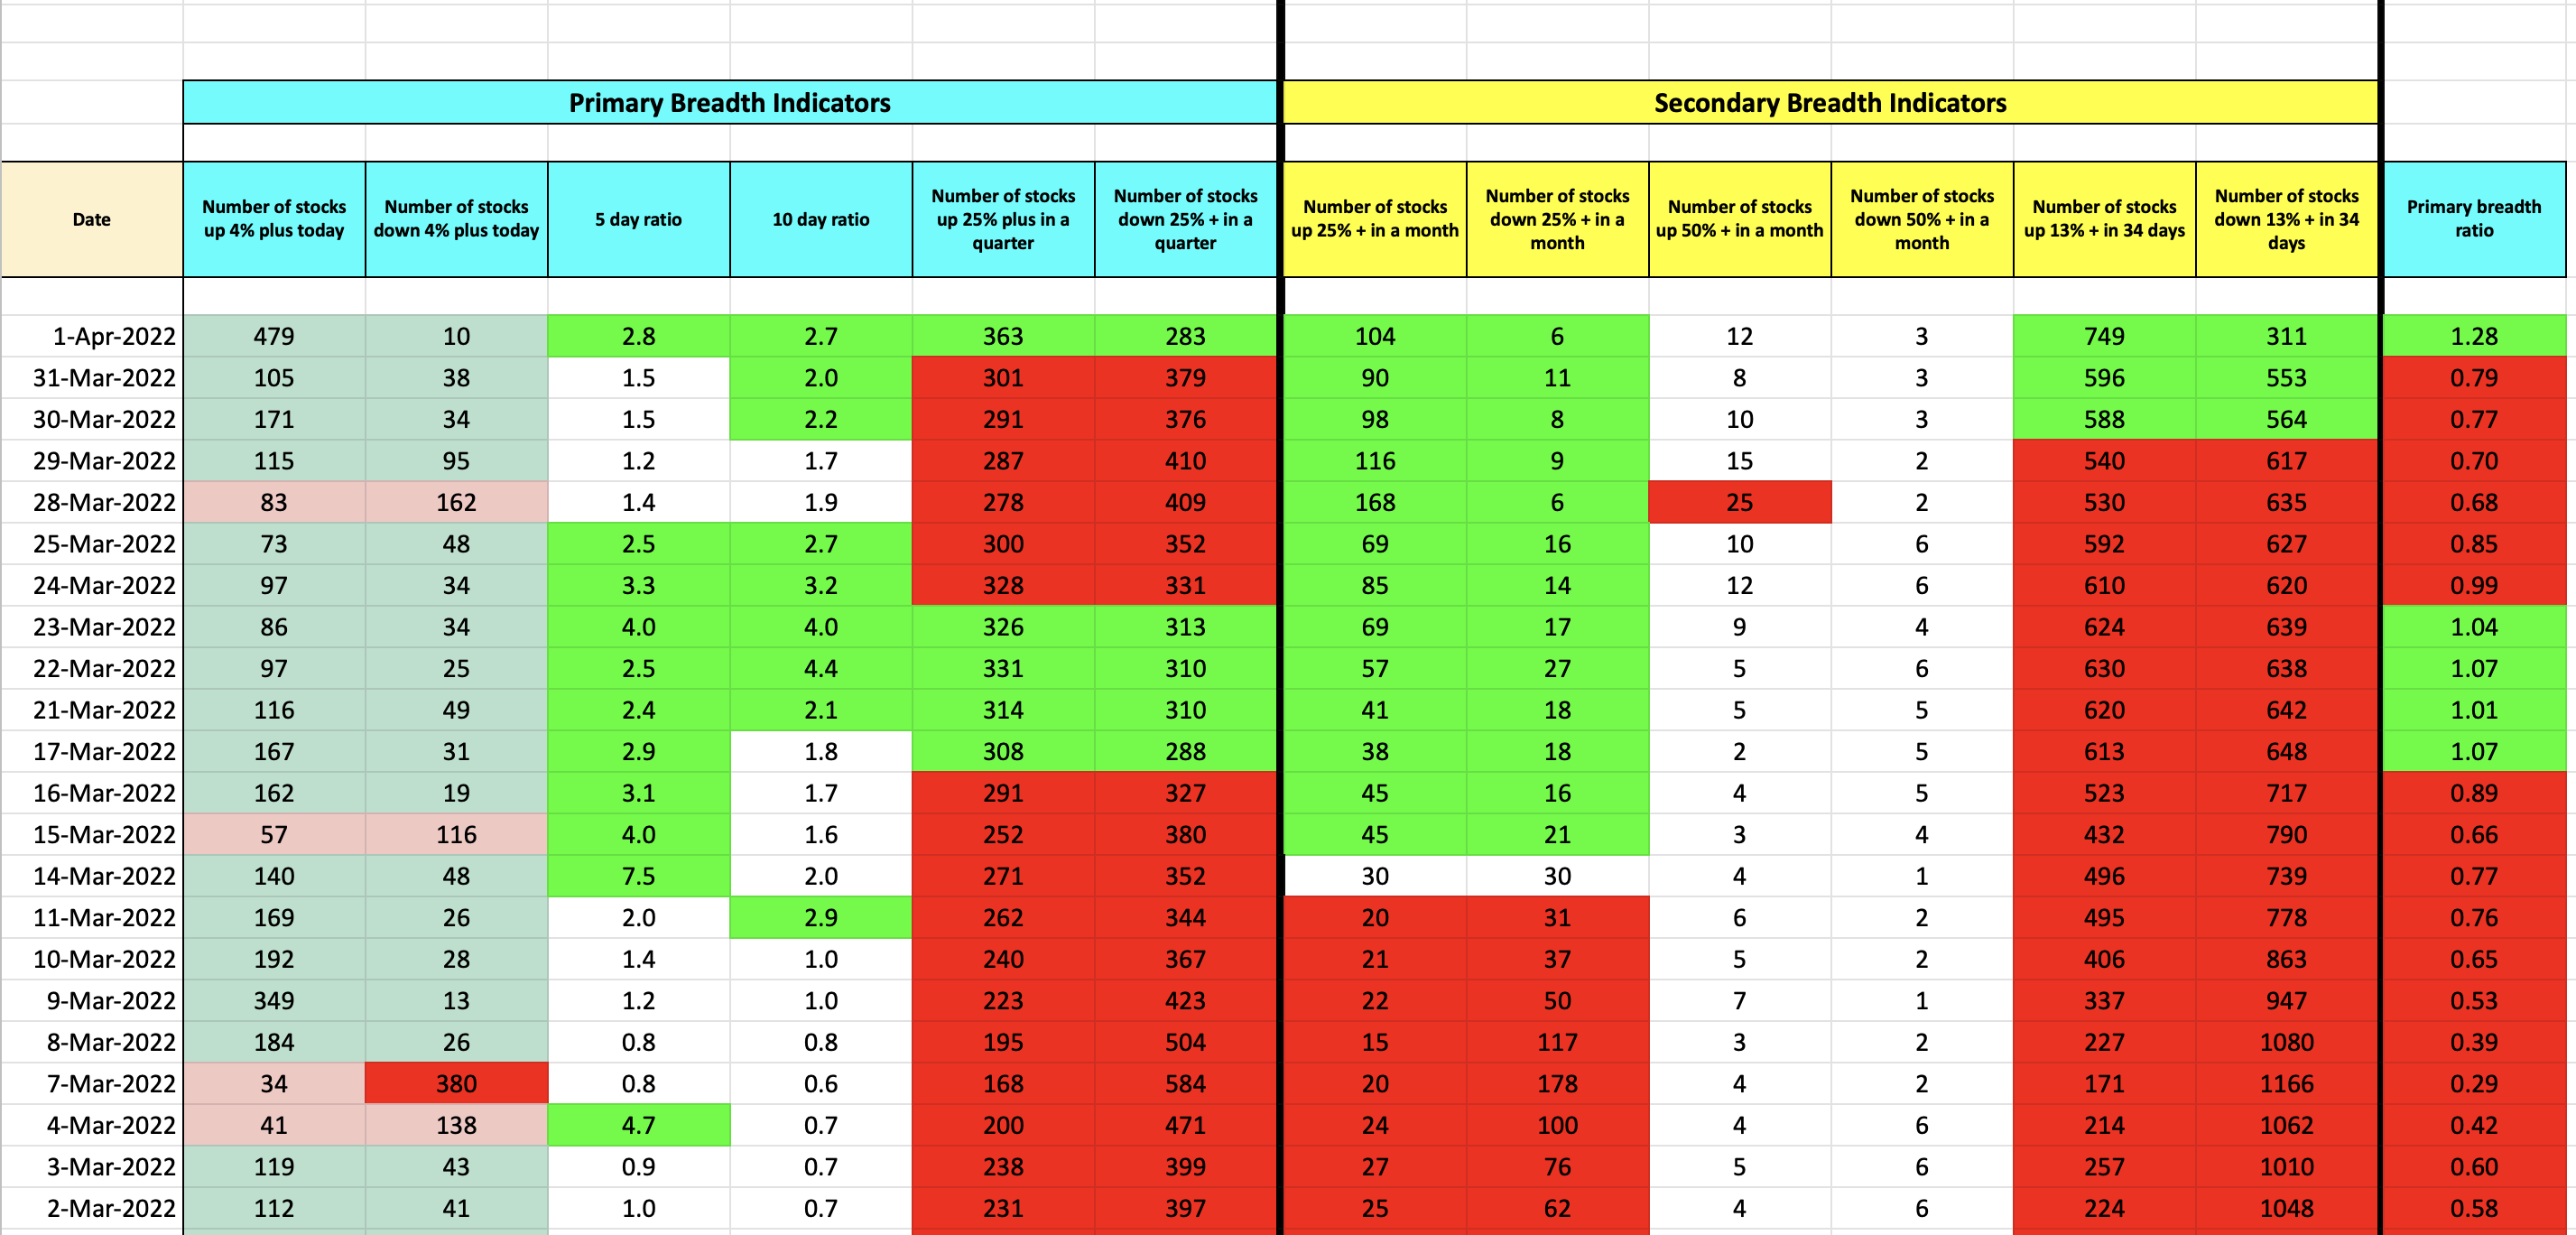
Stockbee Market Monitor
On a modified Stockbee market monitor, the short-term bearish phase (13% up in 34 days) is finally over after 5 weeks. Also, the long-term metric of stocks 25% plus quarter is now back in the green.
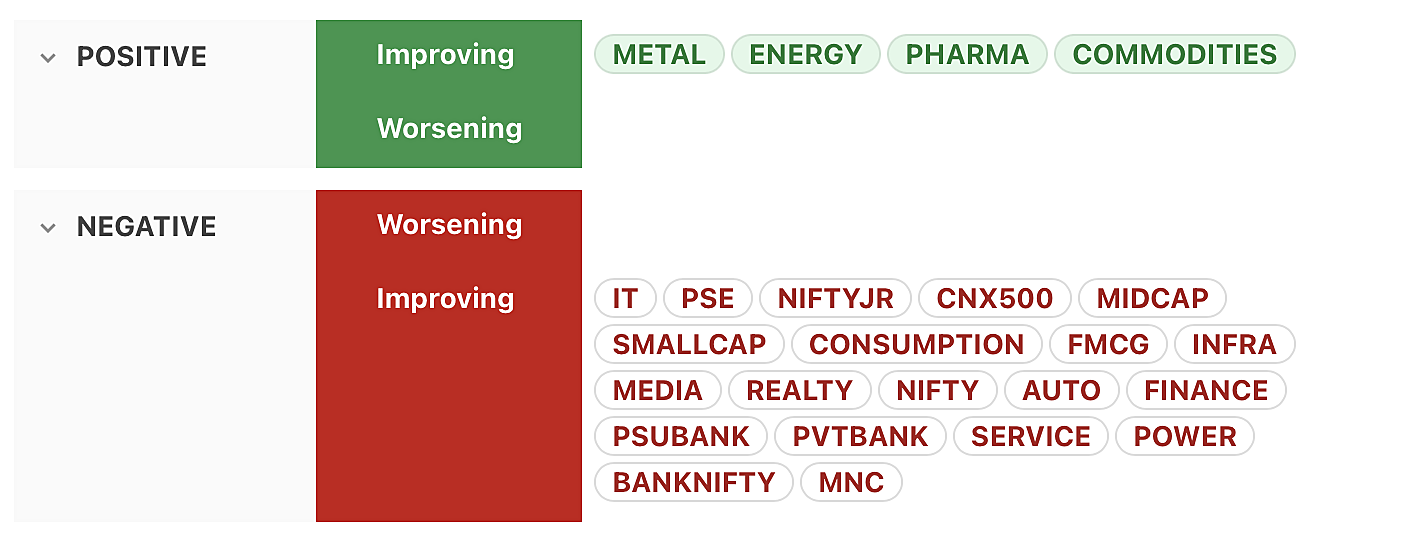
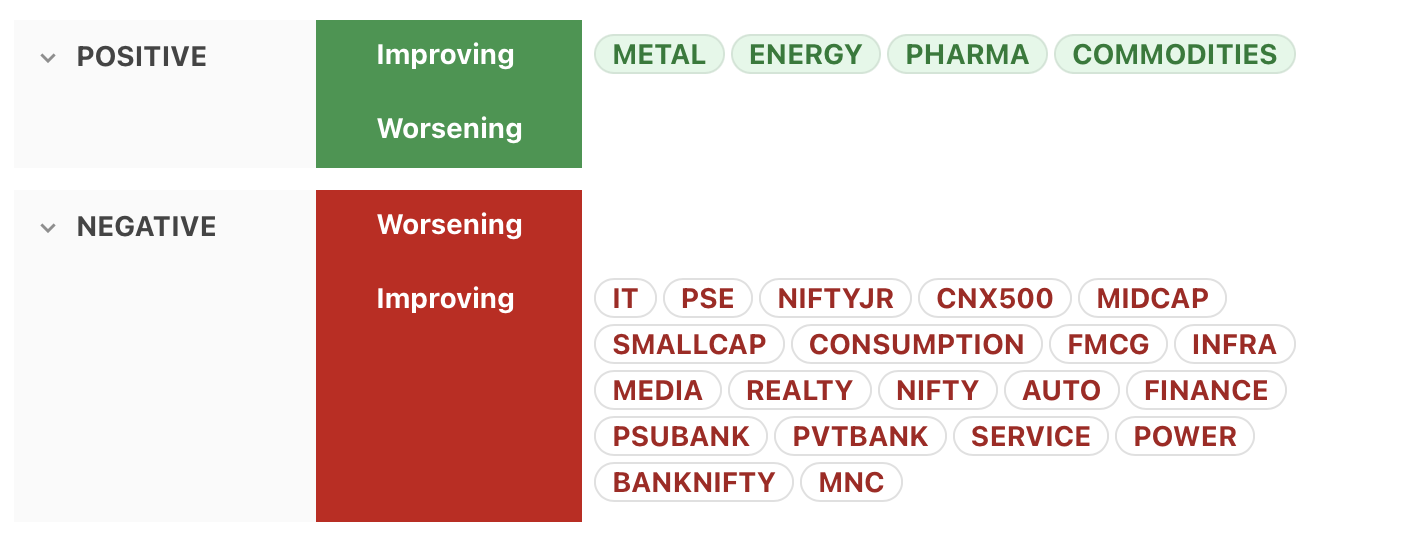
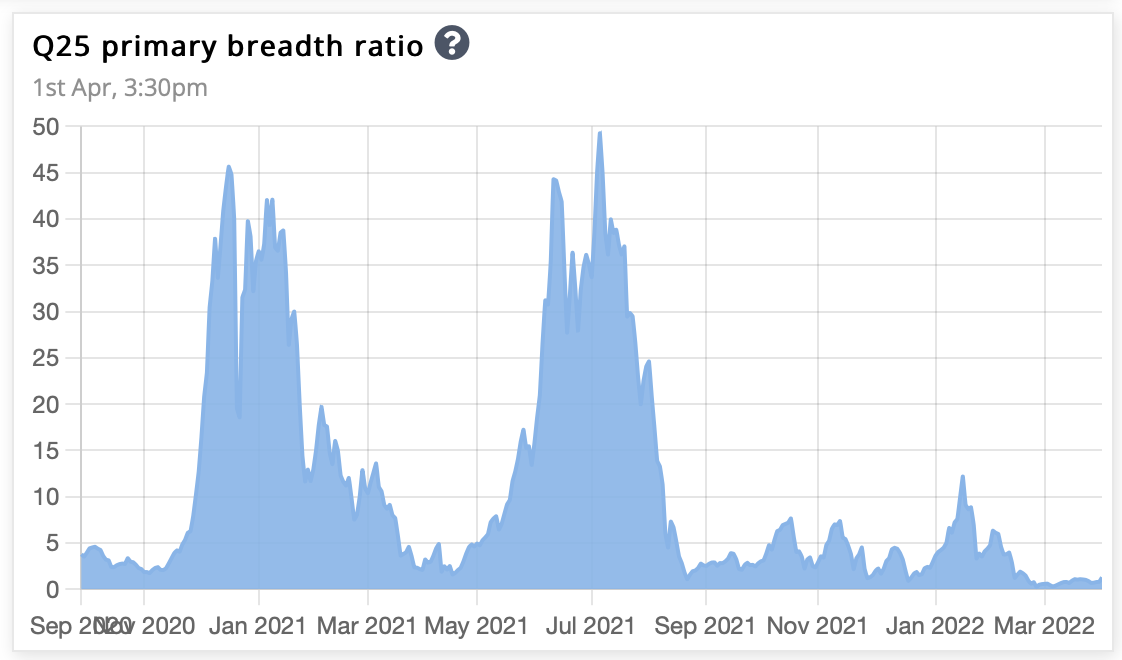
Primary Breadth Ratio
Overall, the market is bullish, as the number of stocks up 25% plus in a quarter is now greater than that down 25% plus in a quarter. The ratio between the two is the primary breadth ratio, which is now 1.28.
That’s all for this week. If you'd like to know when I publish something new, just subscribe to my newsletter and you'll get the latest sent direct to you.
.png?disposition=attachment)