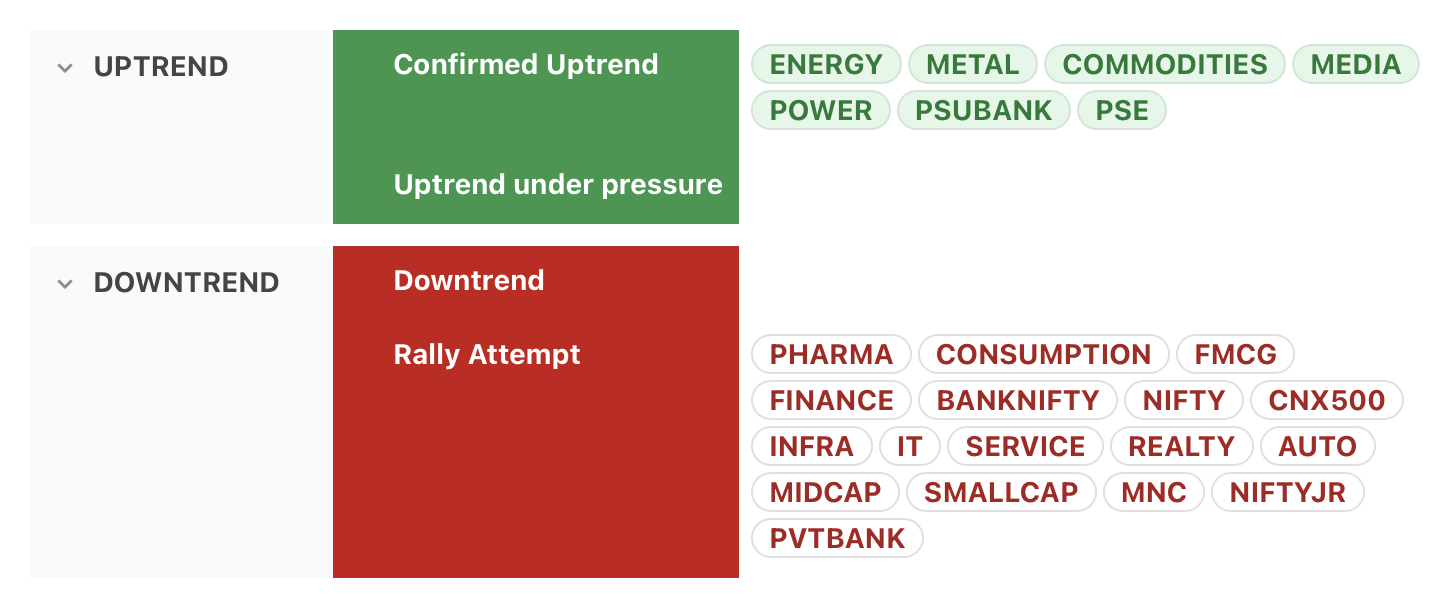
⦿ Most major indices (including Nifty, Midcap, Smallcap, CNX500, Banknifty) are now in rally attempt.
⦿ PSE index joins Power, PSUbank, Media, Commodities, Energy & Metal as confirmed uptrend indices
⦿ No index in outright downtrend
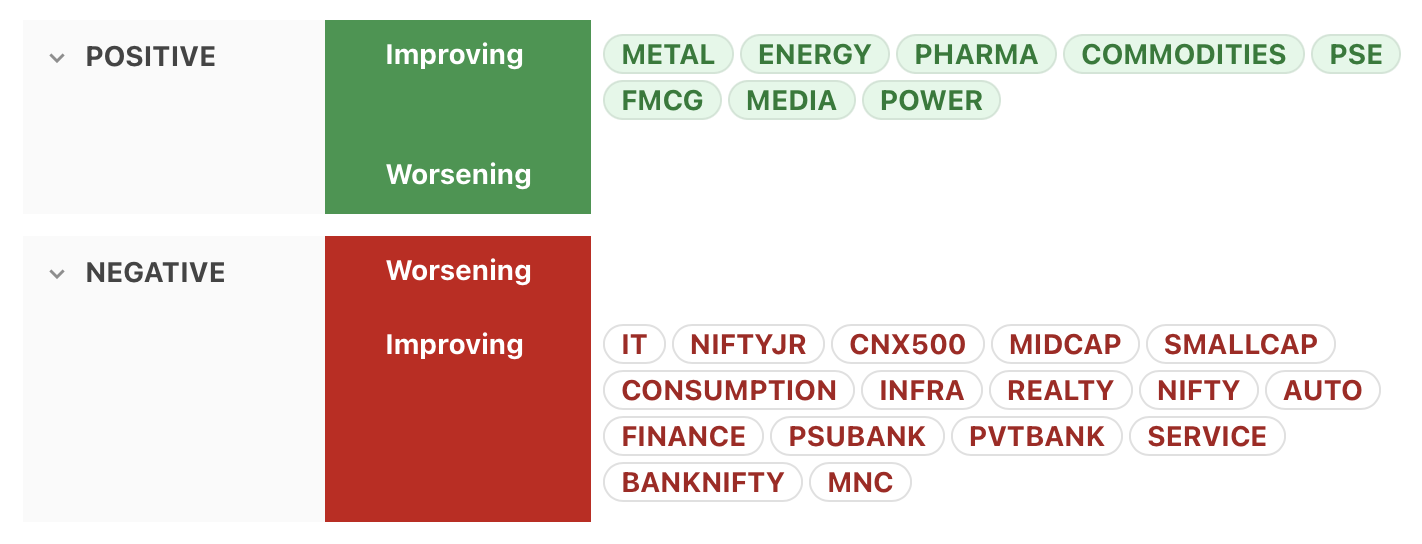
Momentum
⦿ PSE, FMCG, Media & Power join Commodities, Metal, Energy & Pharma as indices with positive & improving momentum
⦿ All other indices have negative but improving momentum, & most are on the verge of entering positive momentum territory
⦿ No index with worsening momentum
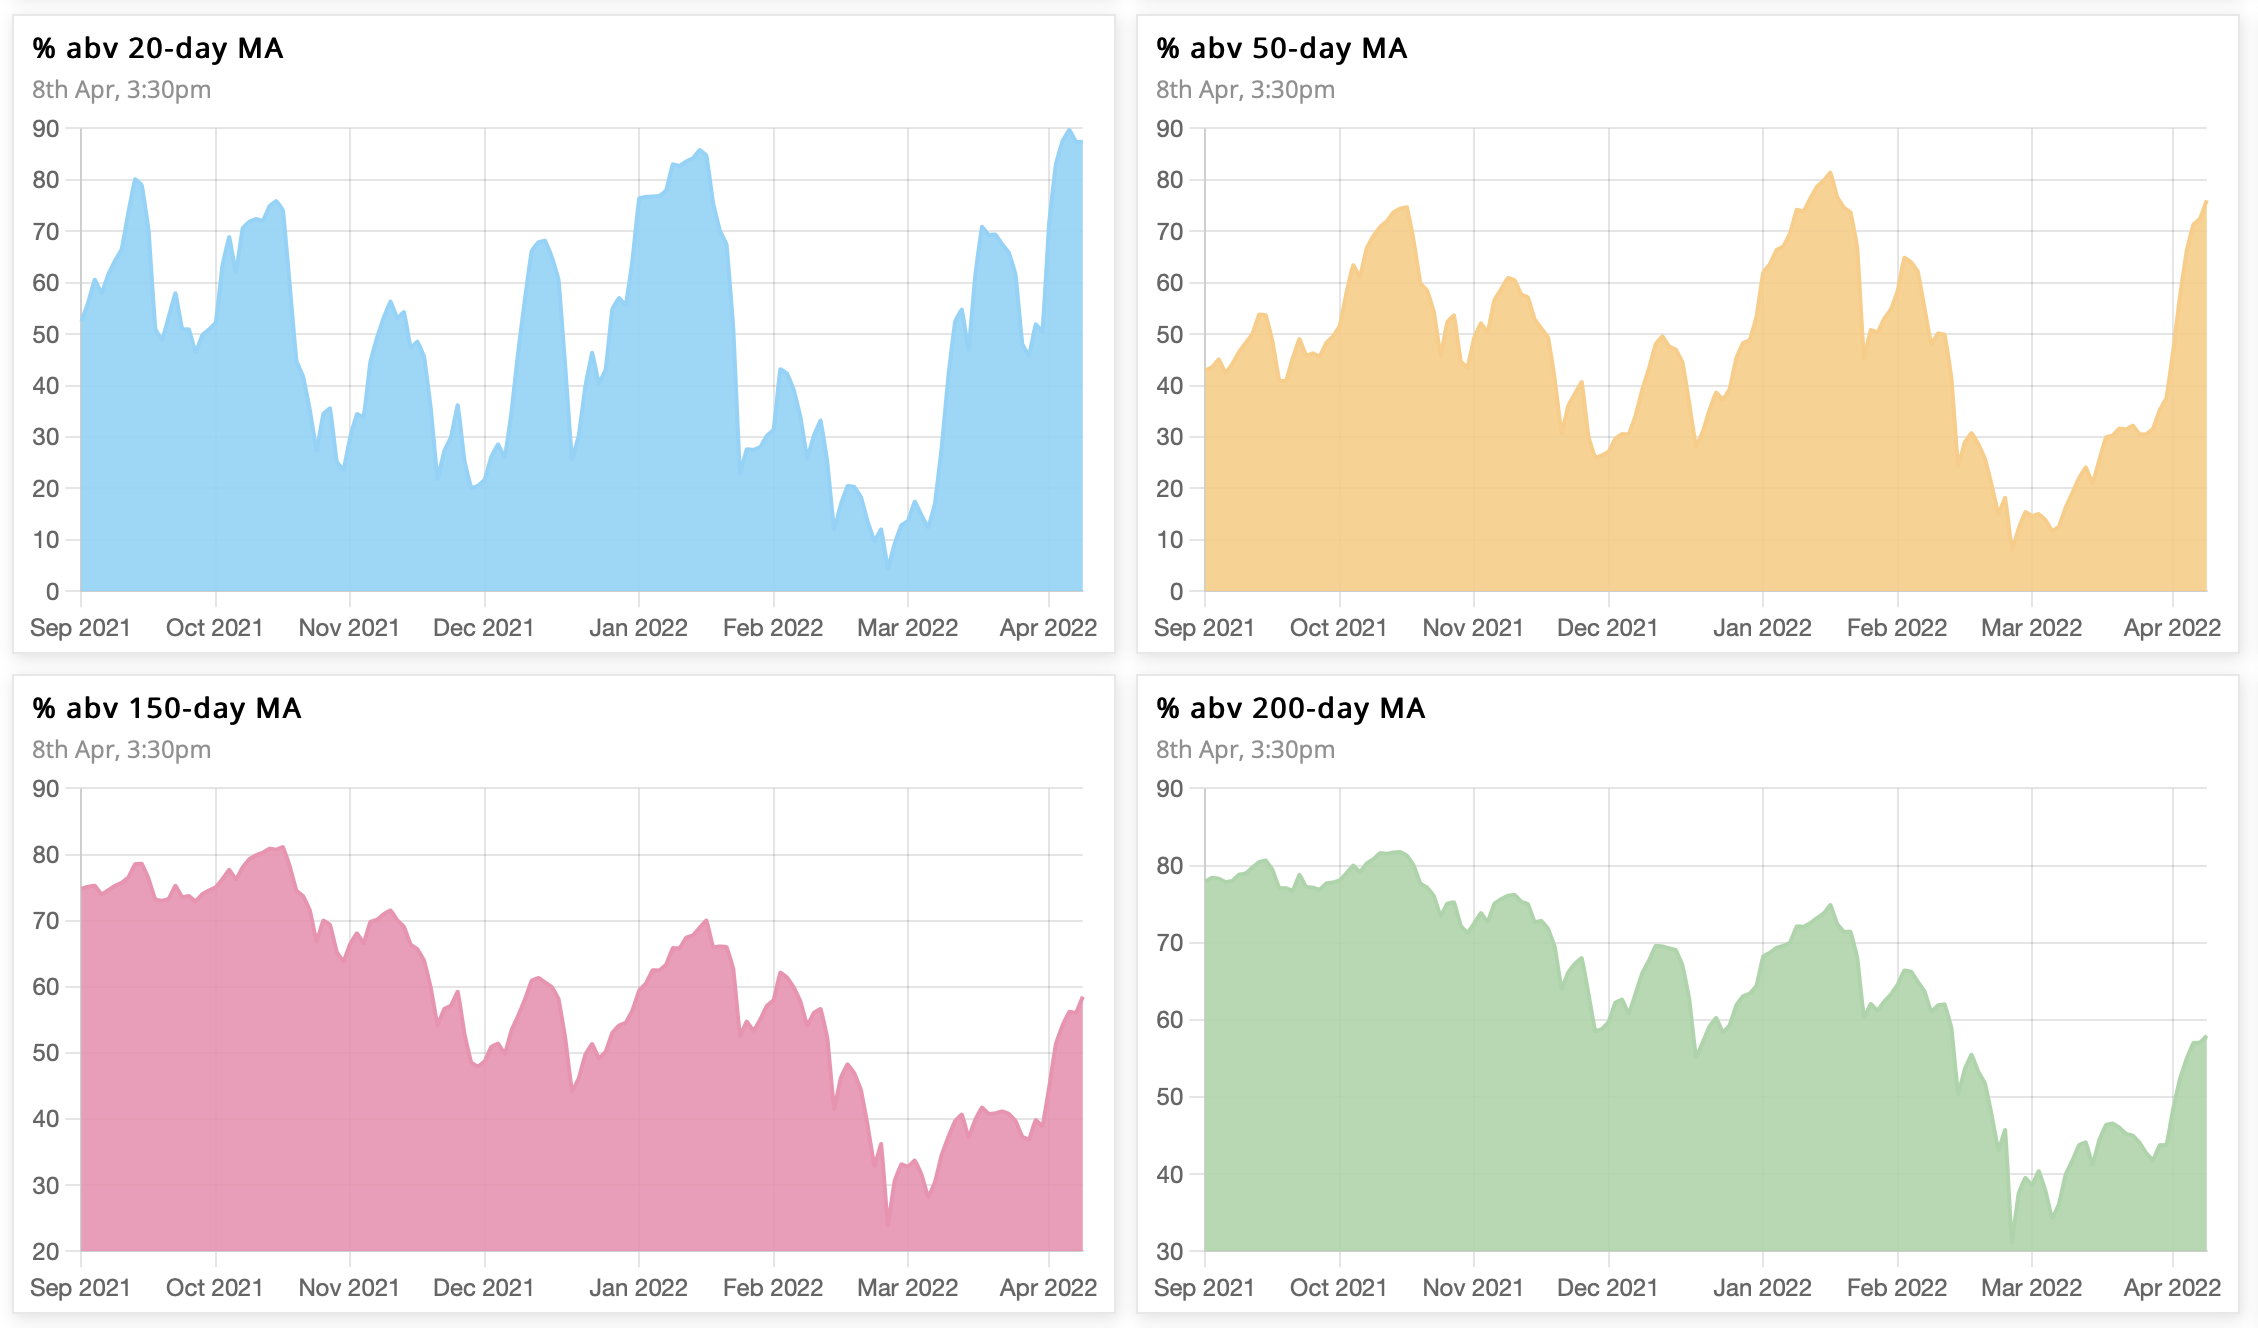
Market breadth
Market breadth improving on all timeframes. Higher timeframes now back to bullish bias, while lower timeframes overbought.
⦿ 70% → 87% above 20 MA (overbought)
⦿ 46% → 76% above 50 MA (fresh buy signal)
⦿ 44% → 58% above 150 MA (bullish bias)
⦿ 47% → 58% above 200 MA (bullish bias)
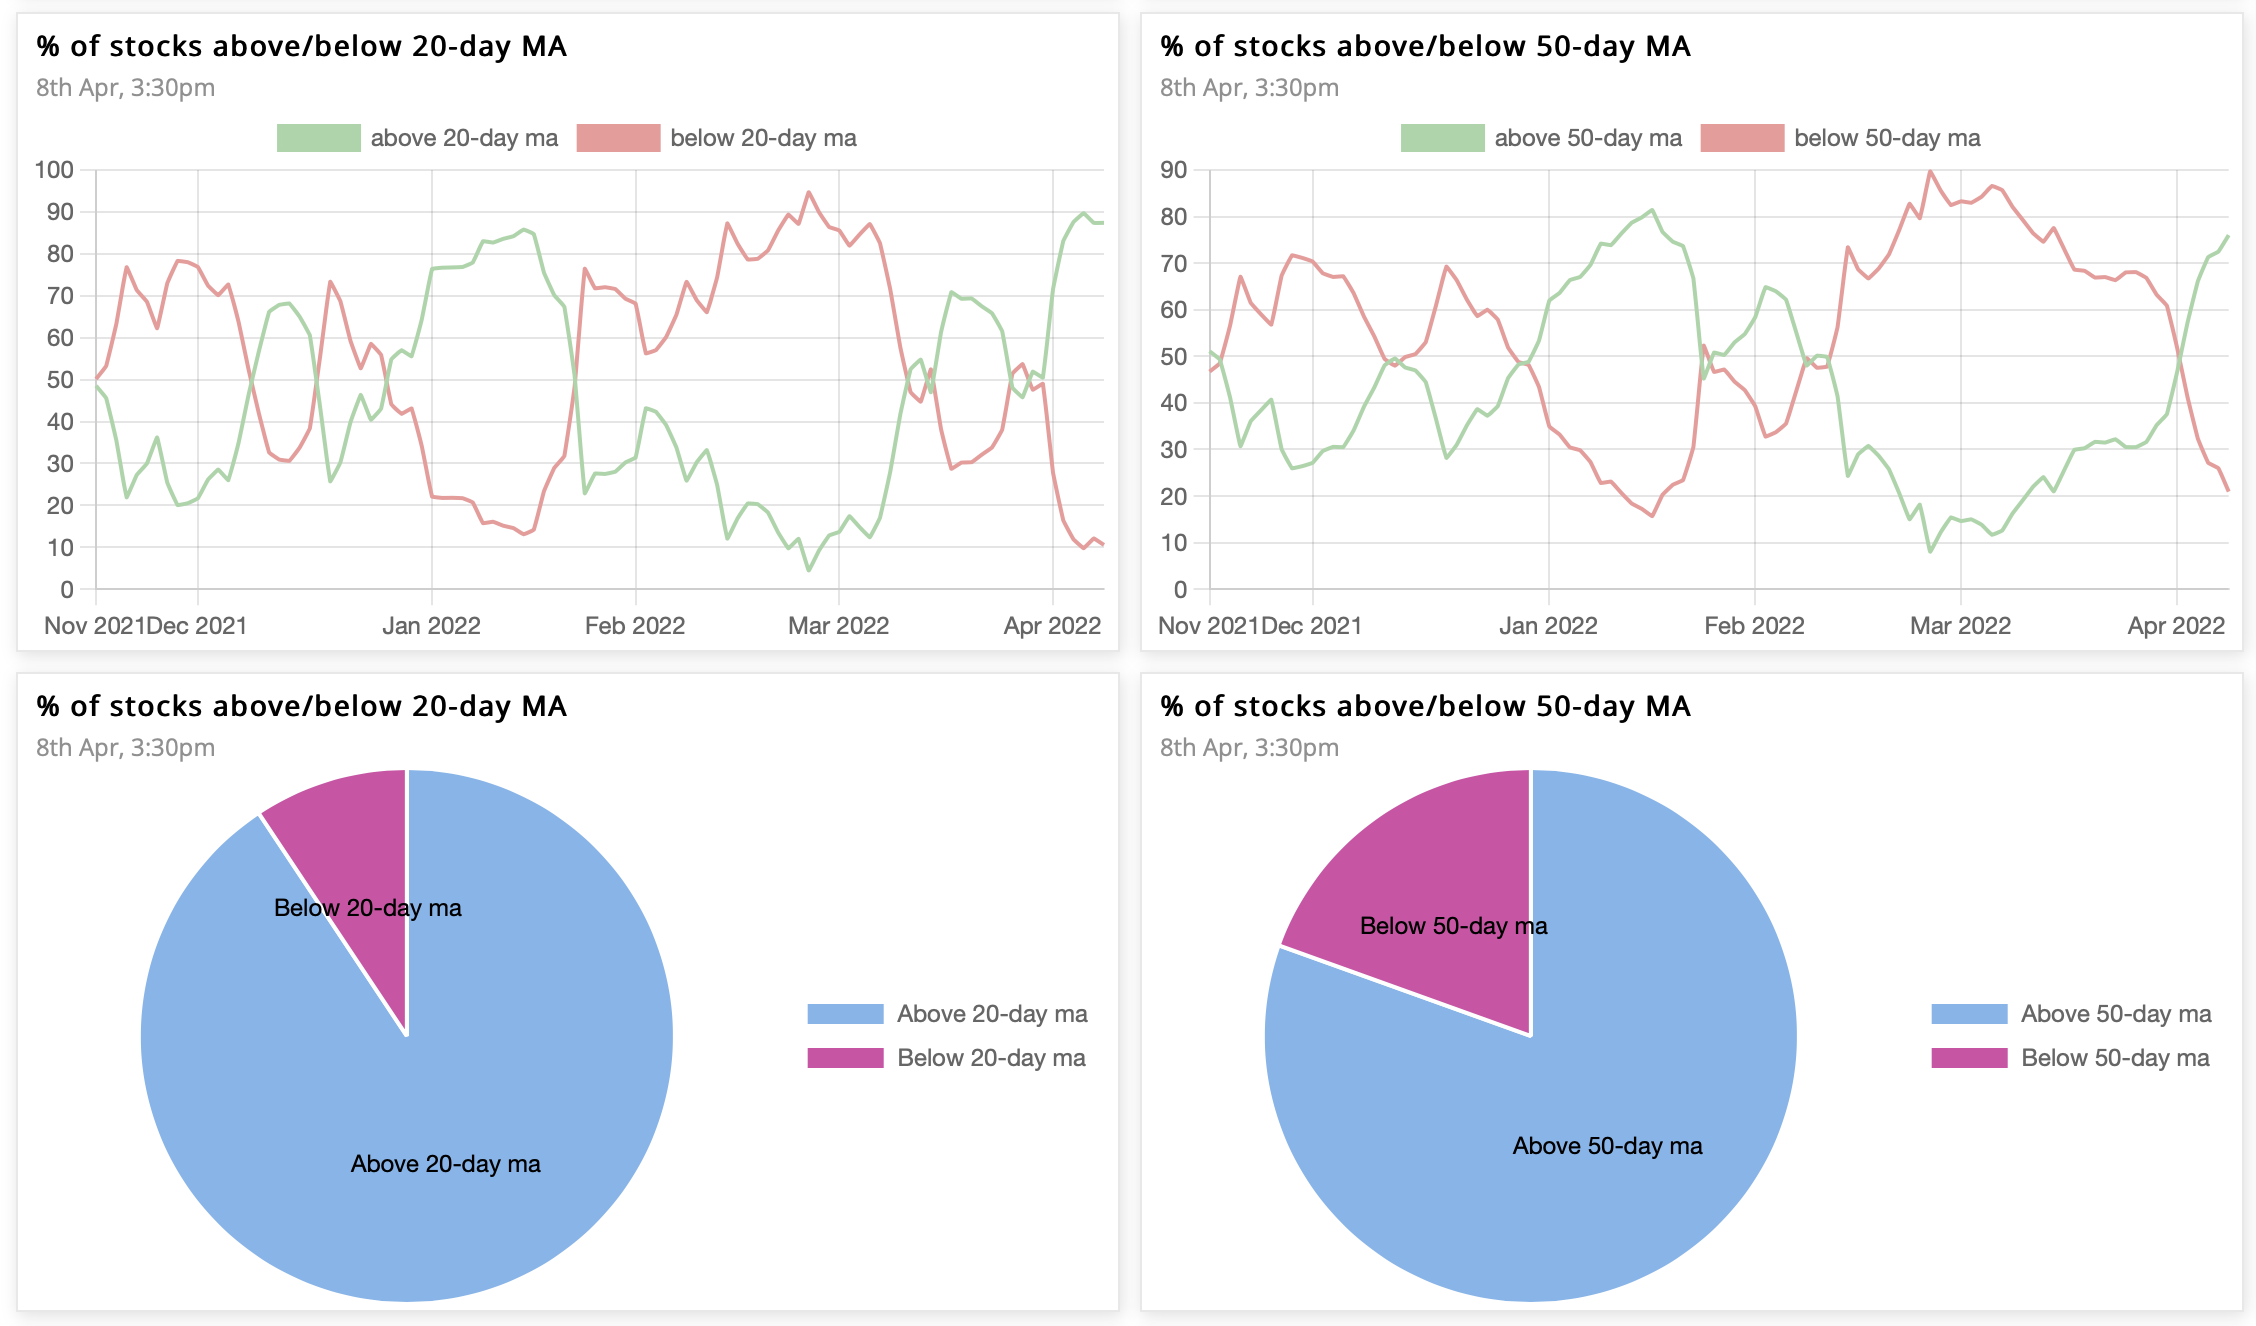
% of stocks above/below 20& 50MA
The Ratio between stocks above & below 50MA is 4, while that for 20MA is 9.7. The 10-day cumulative ratio for stocks above 50MA is 1. A value >2 is good for swing trades on the long side.
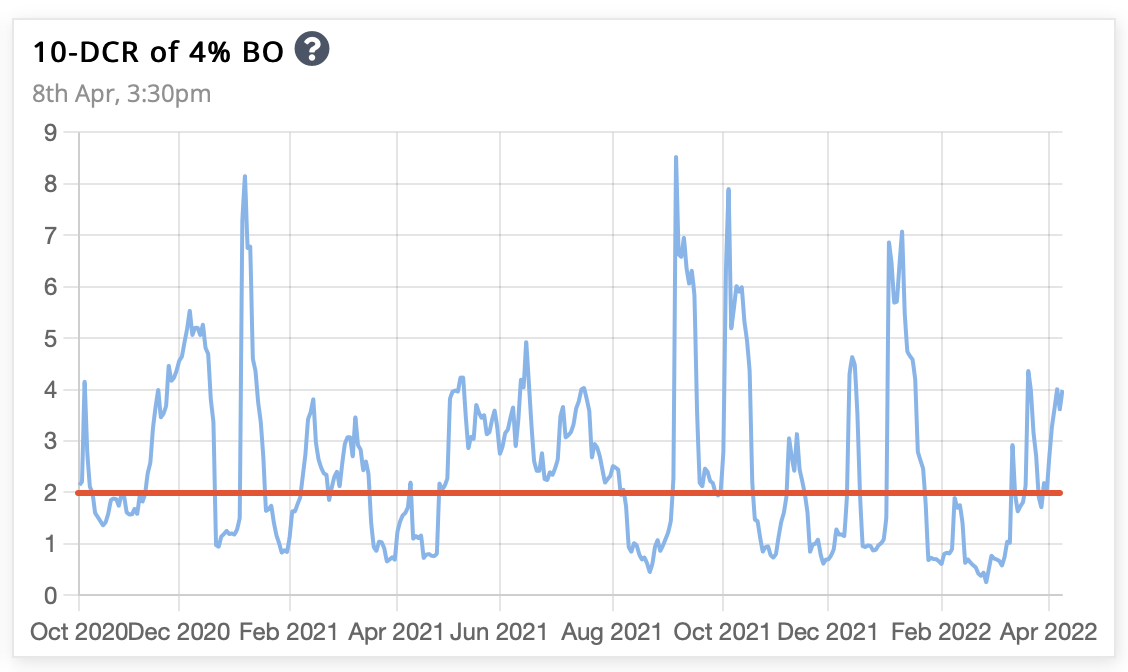
4% up/down in 1 day
The 10-day cumulative ratio between stocks up & down 4% in a day stays in the green (>2), signalling that short-term trading oppurtunites are there.
When market is in bearish phase, a fresh bull move starts when 10-DCR first time above 2.
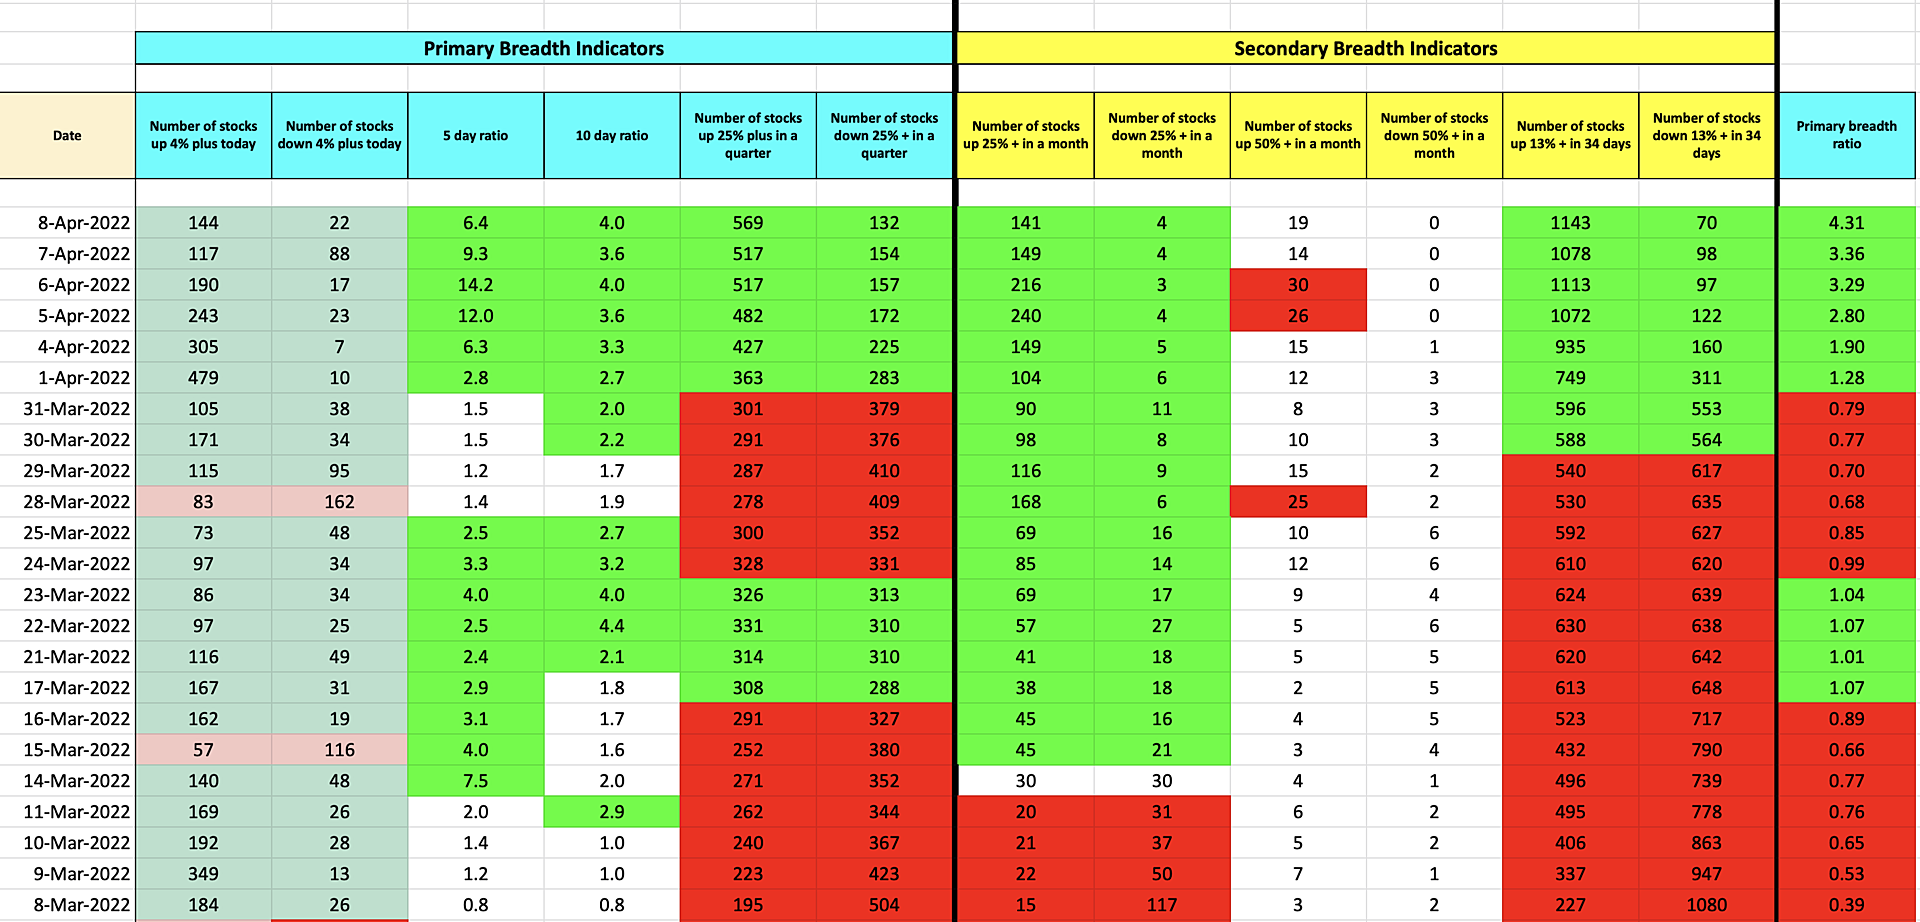
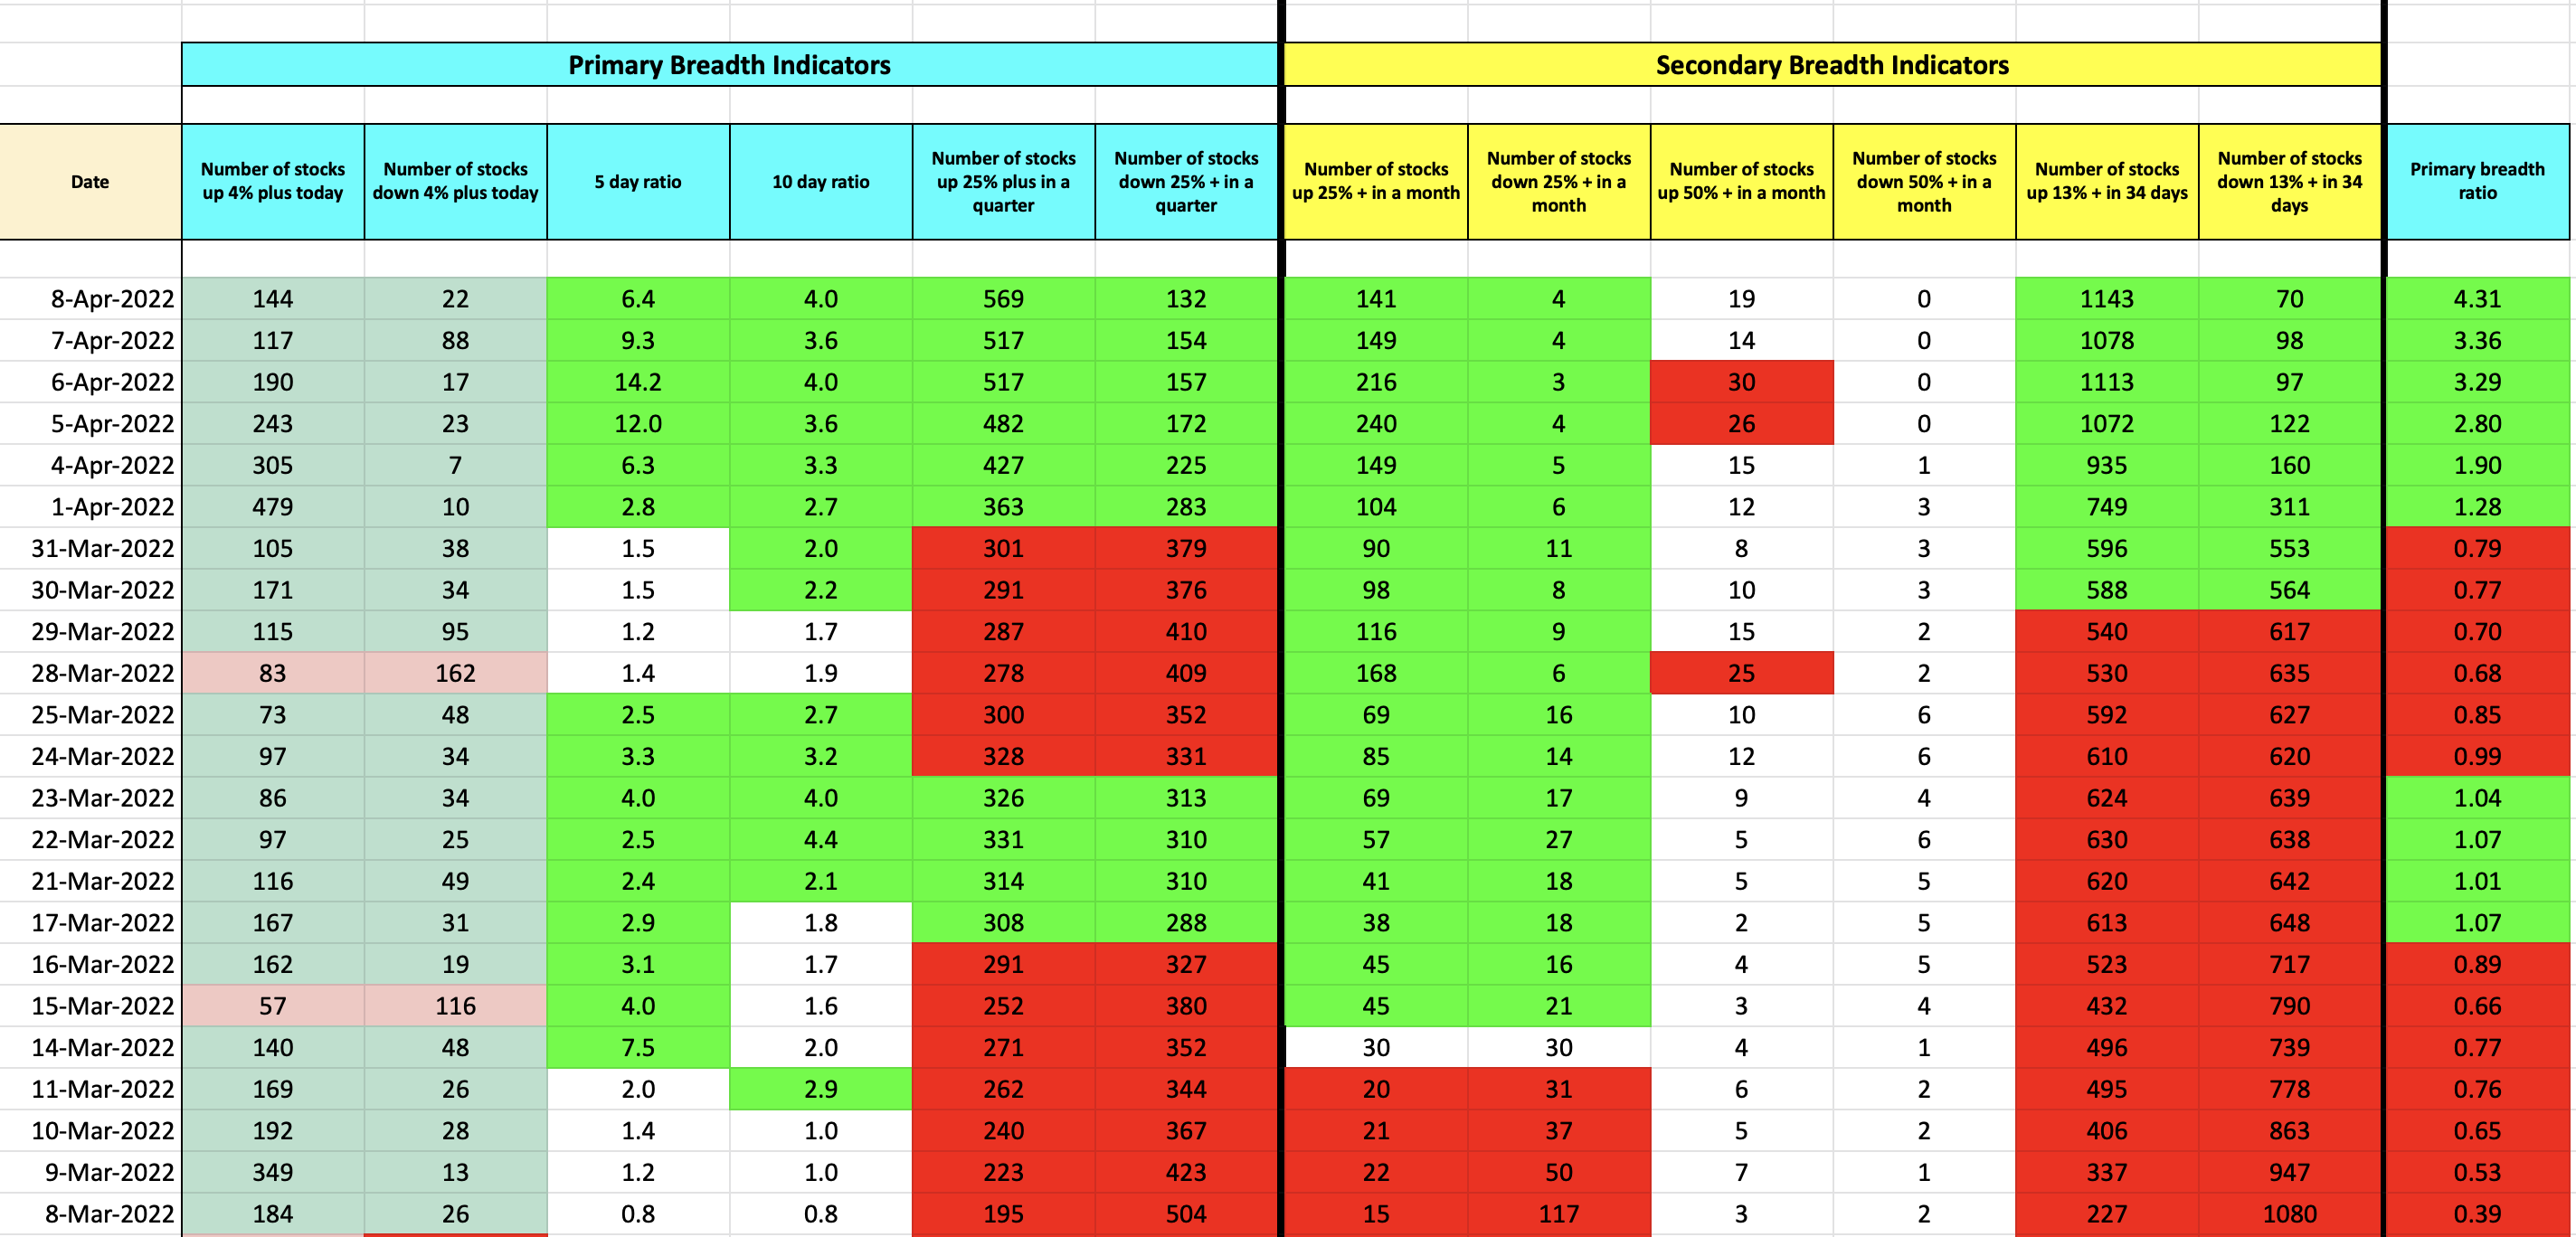
Stockbee Market Monitor
On a modified Stockbee market monitor, both the short-term indicator of 13% up in 34 days & the long-term metric of stocks 25% plus quarter are now green.
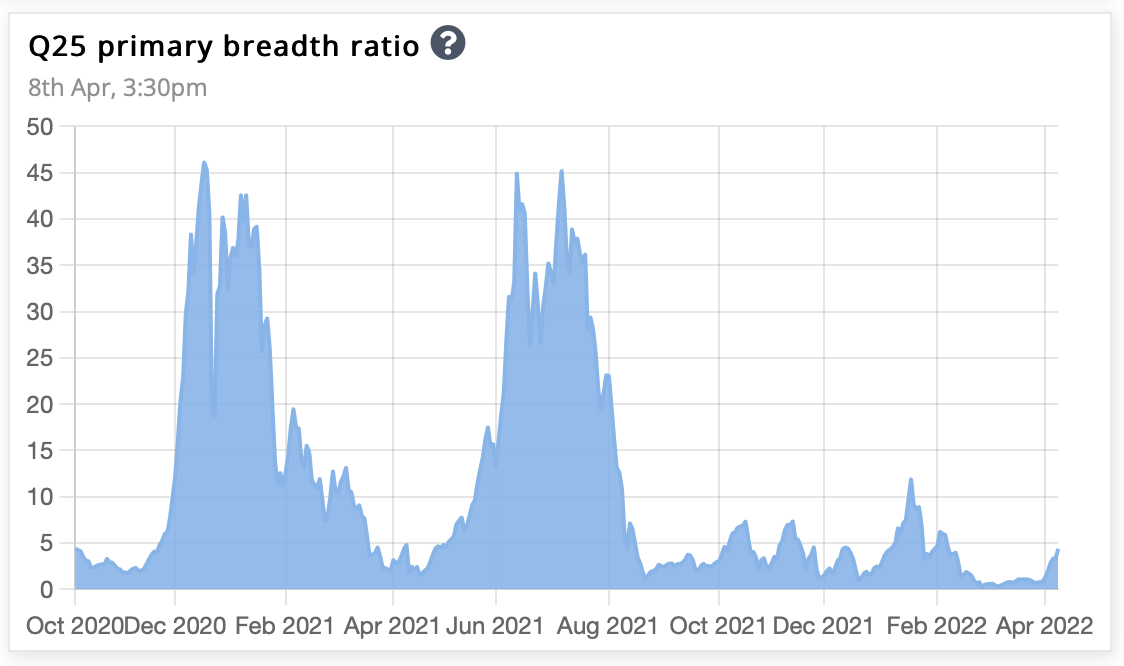
Primary breadth ratio
Overall, the market is bullish, as the number of stocks up 25% plus in a quarter is now greater than that down 25% plus in a quarter. The ratio between the two is the primary breadth ratio, which is now 4.3.
That’s all for this week. If you'd like to know when I publish something new, just subscribe to my newsletter and you'll get the latest sent direct to you.
.png)
.png?disposition=attachment)