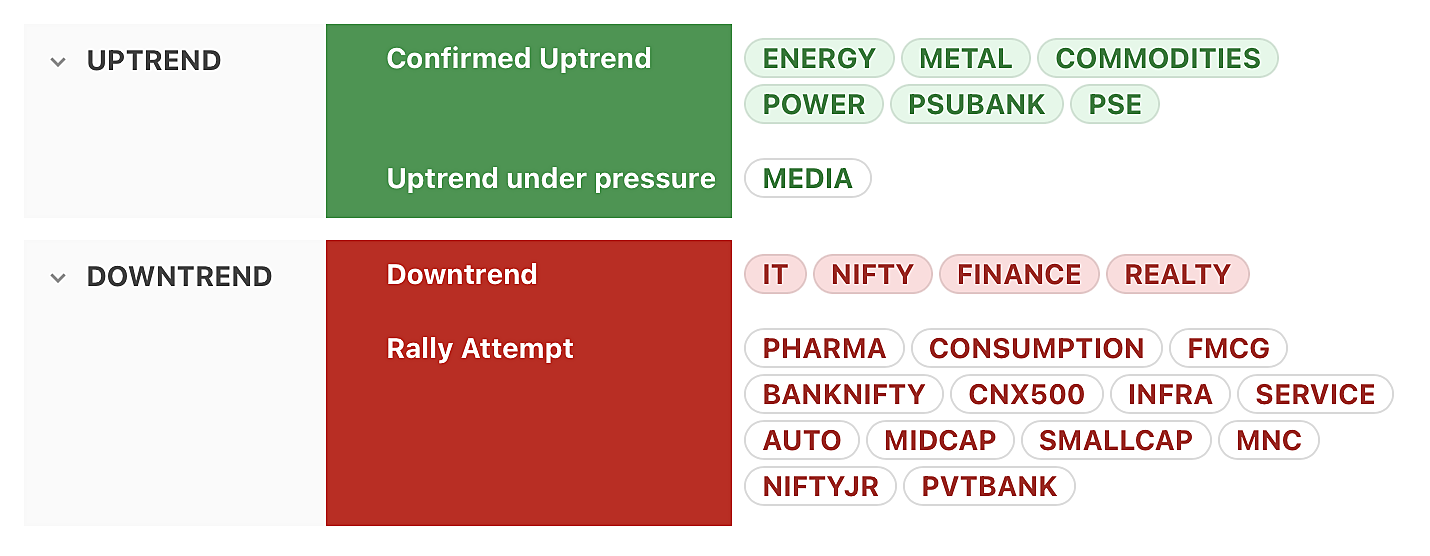
⦿ Most major indices (including Midcap, Smallcap, CNX500, Banknifty) in rally attempt
⦿ After a failed rally attempt, Nifty & Realty join IT in outright downtrend
⦿ Power, PSUbank, Media, Commodities, PSE, Energy & Metal in confirmed uptrend
Momentum
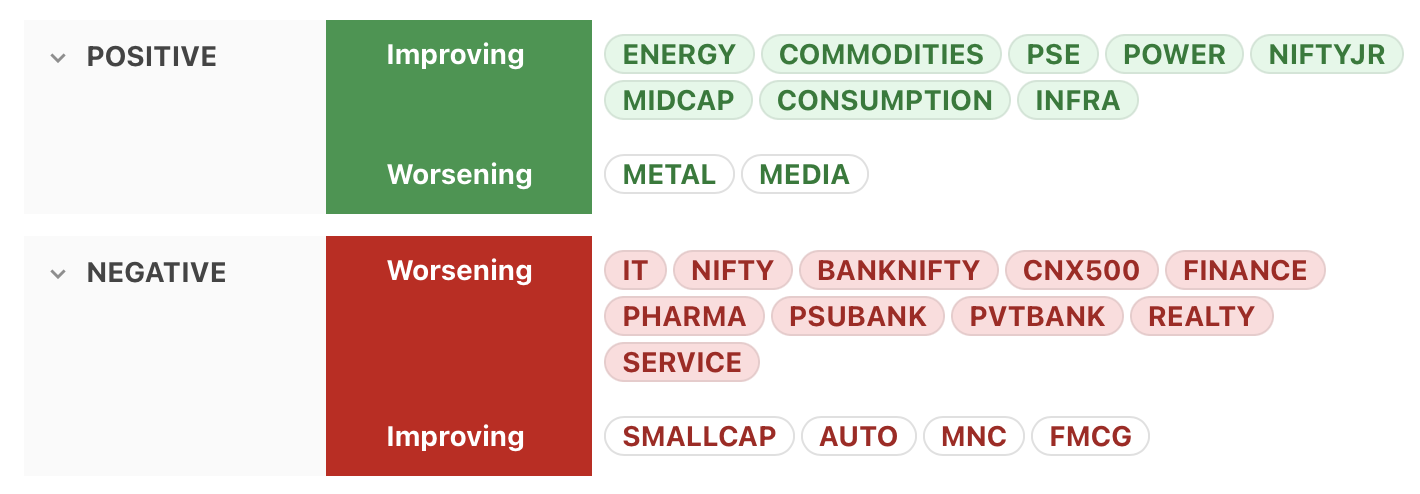
⦿ Both Nifty & CNX500 now have negative & worsening momentum, along with Banks, Realty & Pharma.
⦿ Midcaps & Smallcaps still have improving momentum
⦿ Metals & Media take a breather
Market Breadth
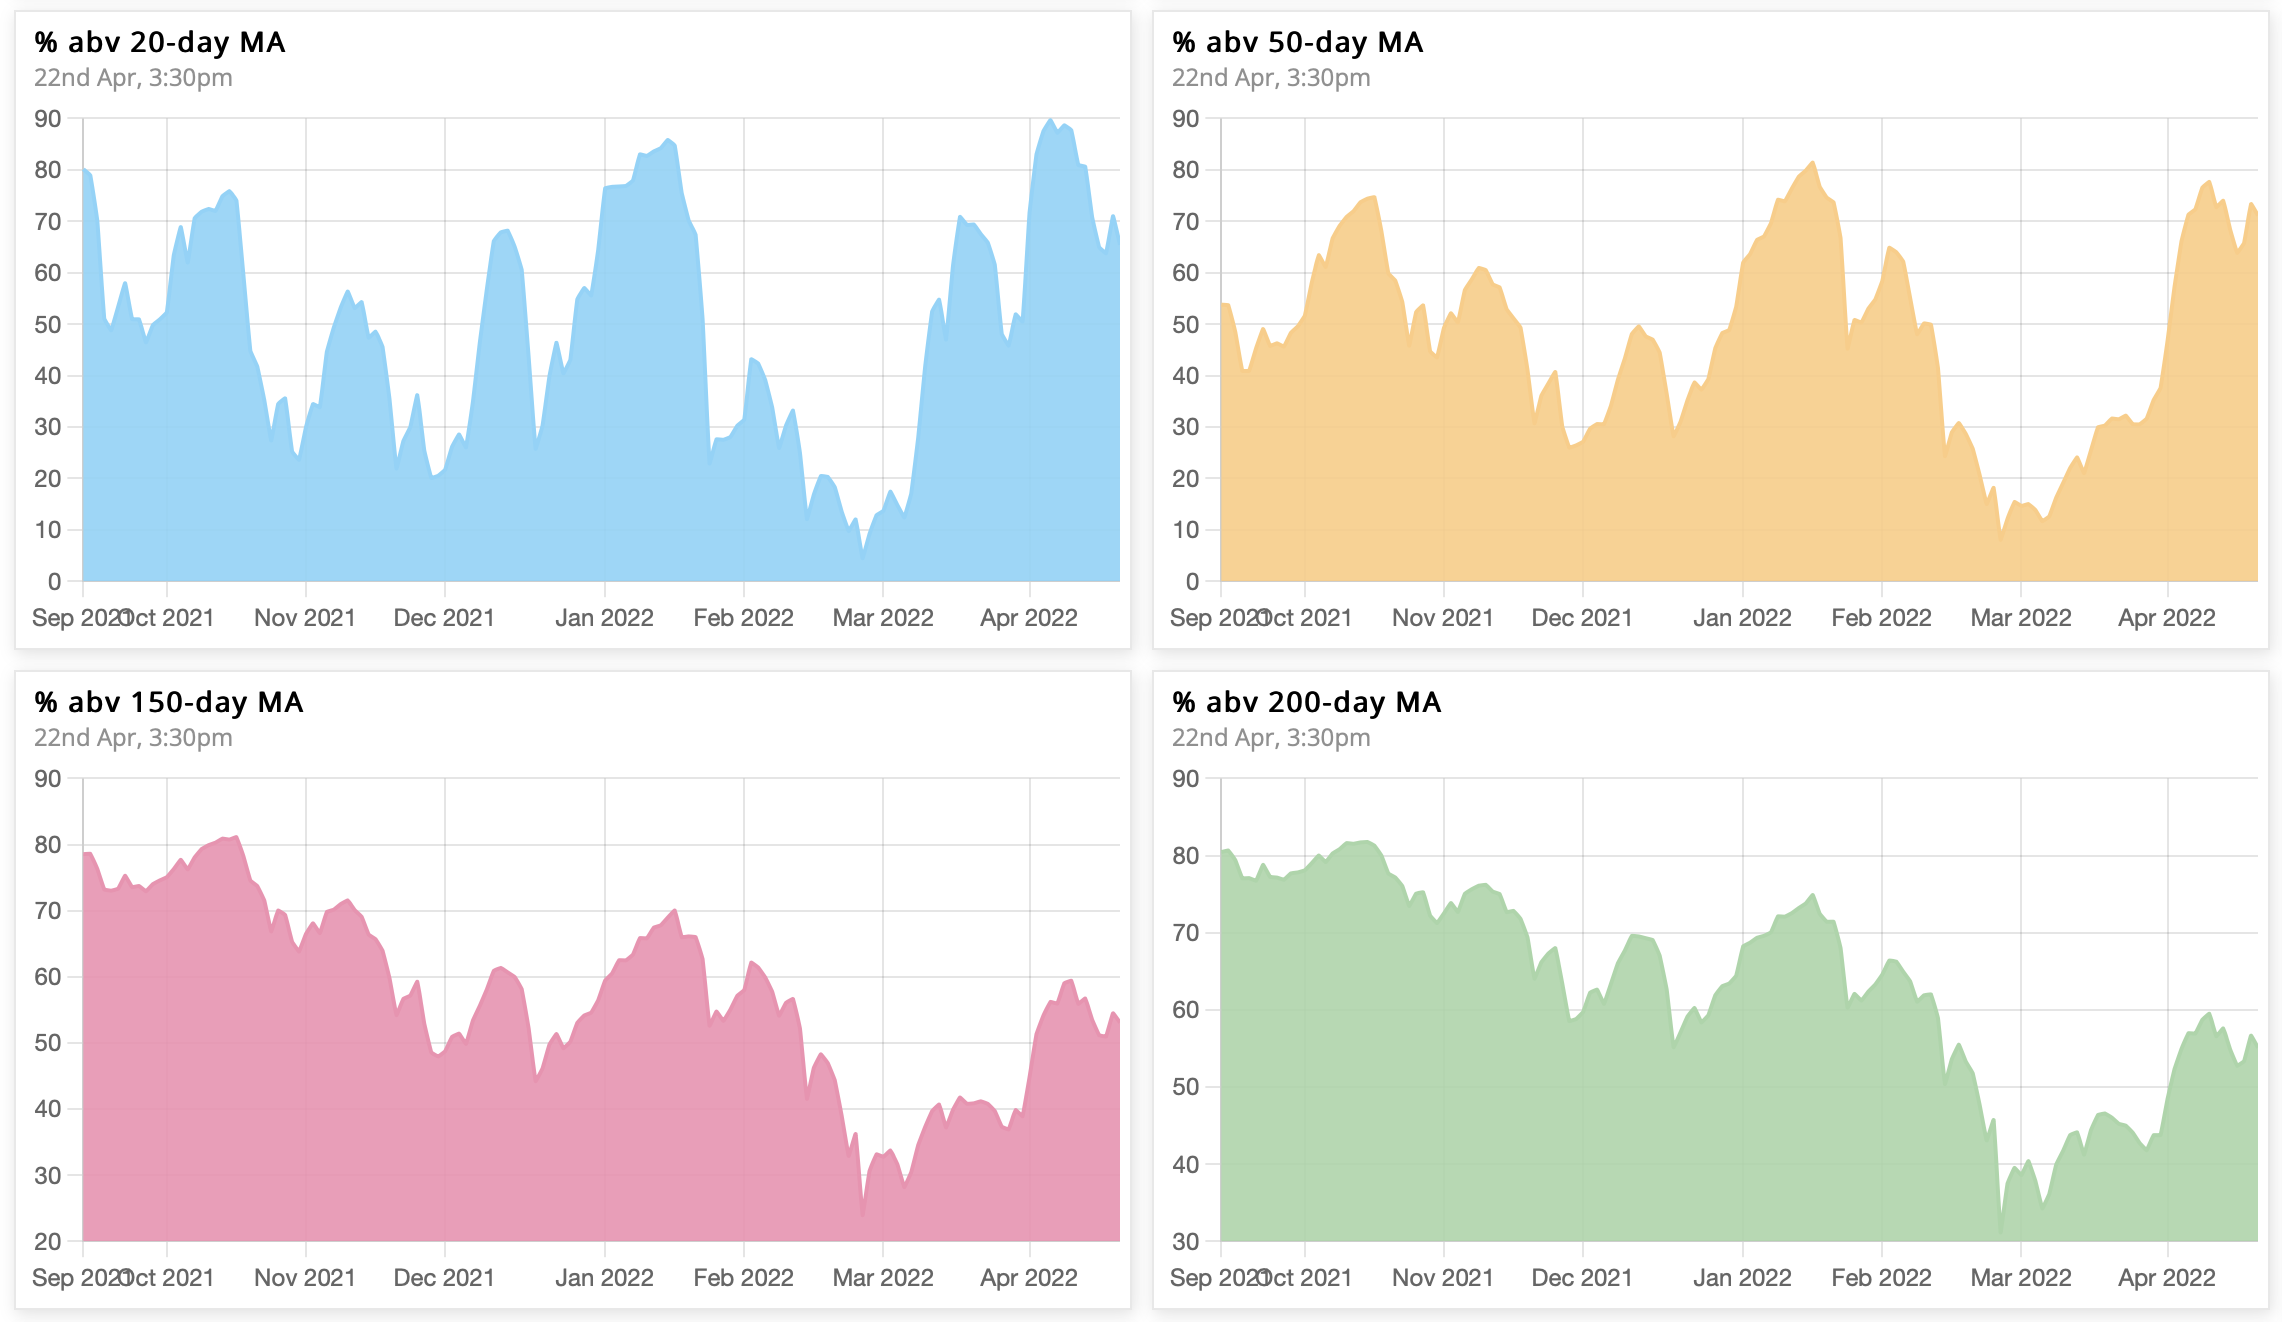
Market breadth weakening on all timeframes.Higher timeframes have weak bullish bias, while lower timeframes are no longer overbought.
⦿ 81% → 65% above 20 MA (neutral)
⦿ 74% → 71% above 50 MA (neutral)
⦿ 57% → 53% above 150 MA (bullish bias)
⦿ 58% → 55% above 200 MA (bullish bias)
% of stocks above/below 20& 50MA
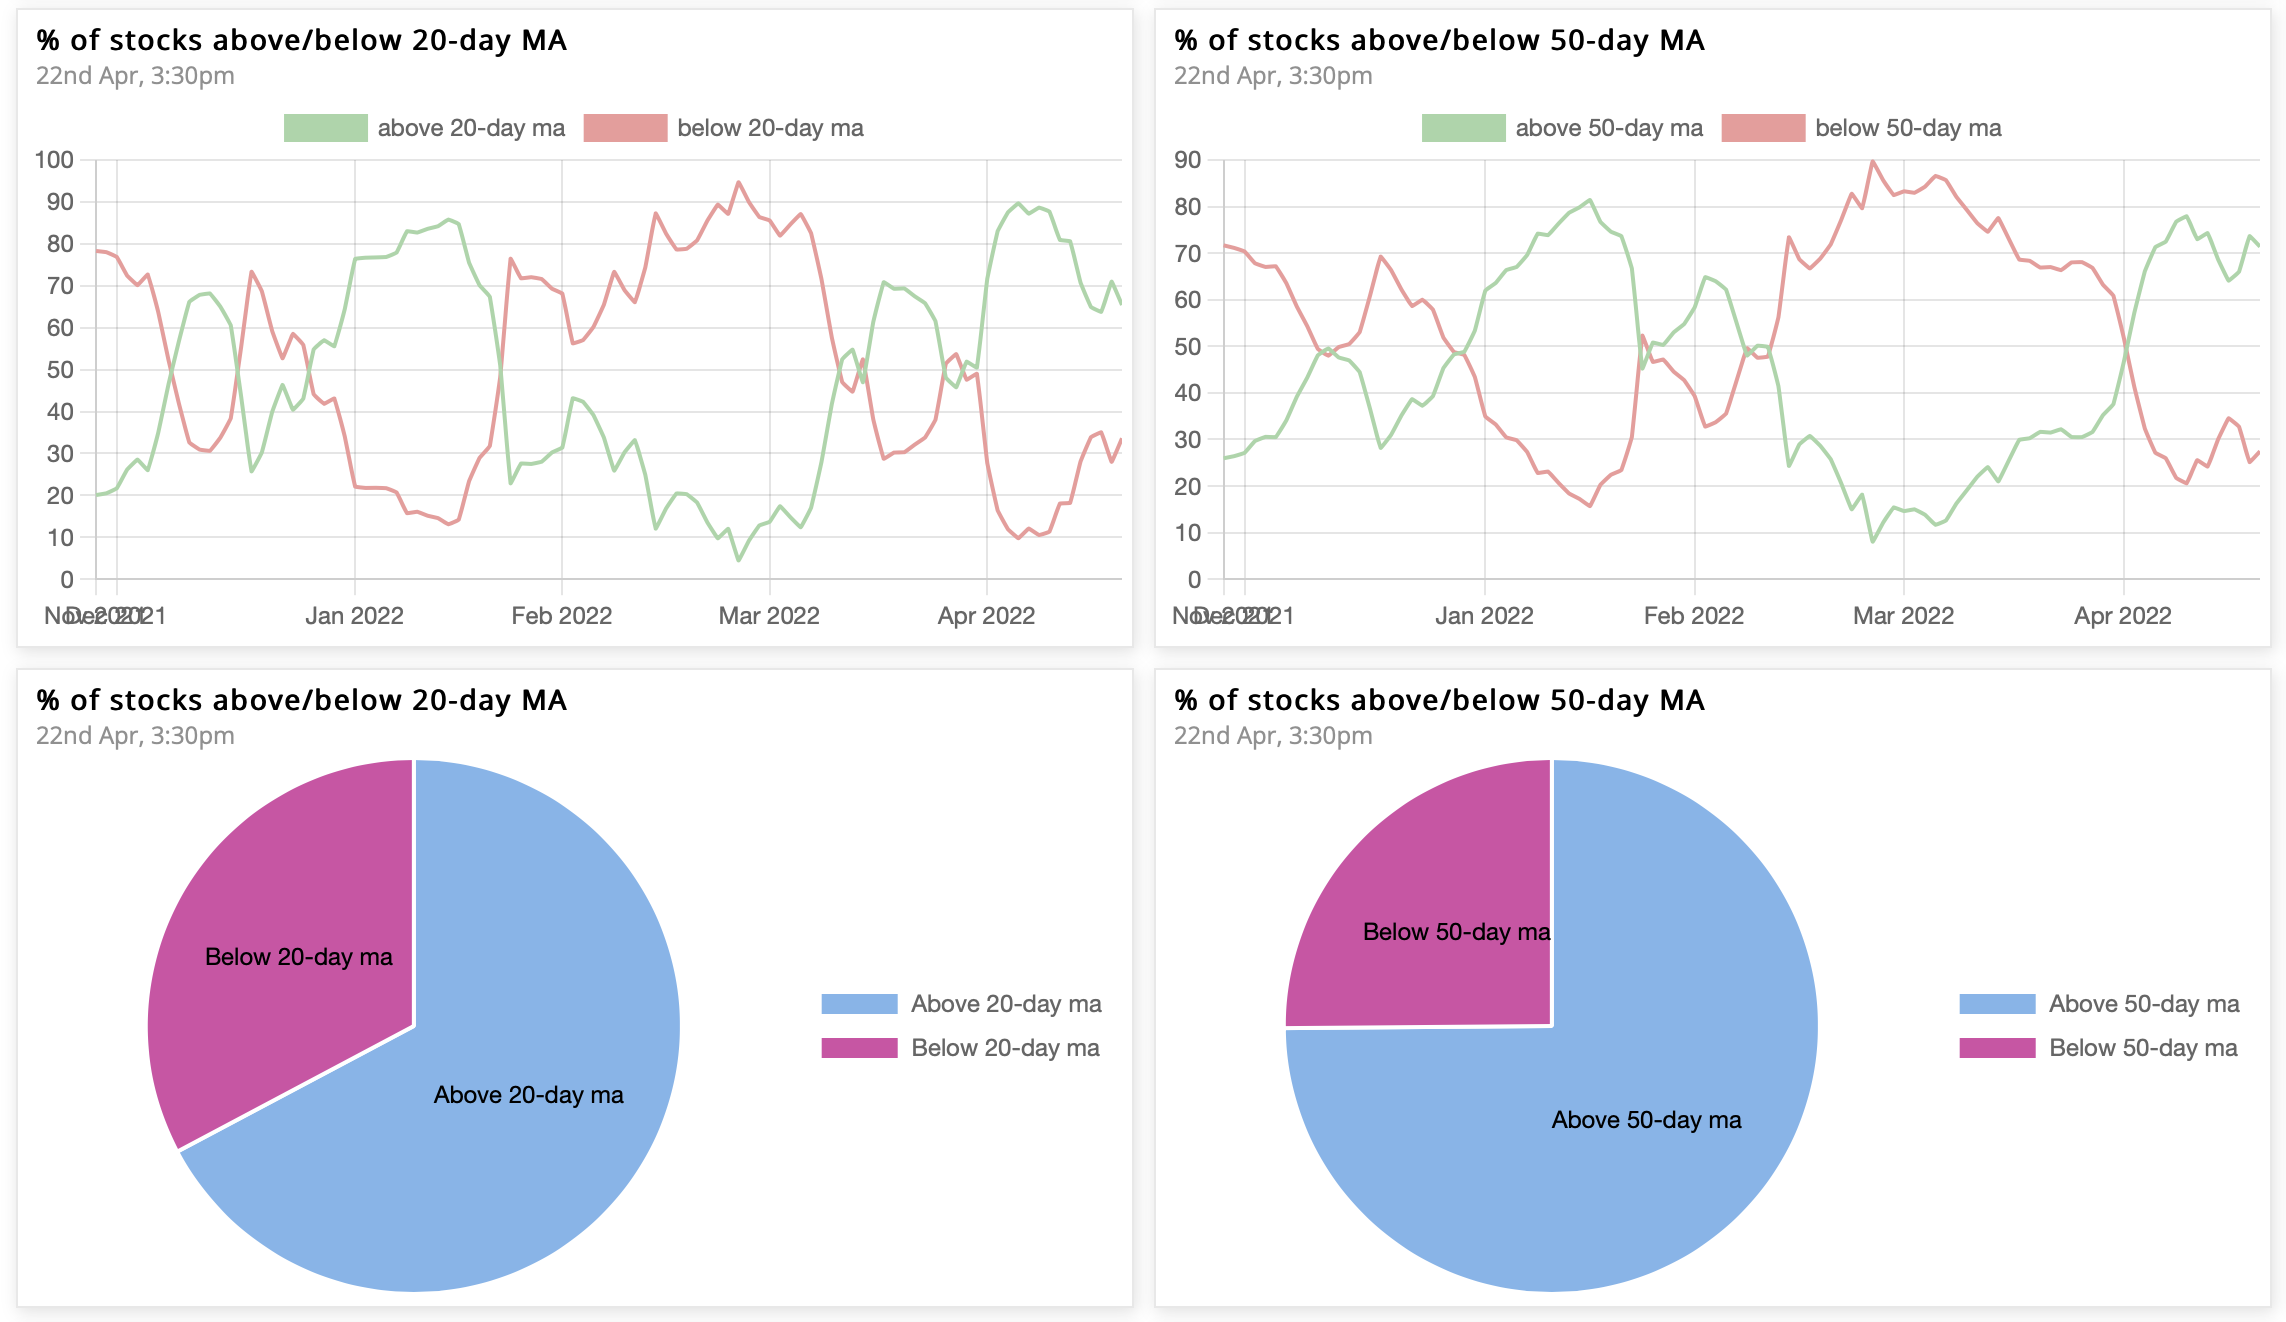
The Ratio between stocks above & below 50MA is 2.9, while that for 20MA is 2.
The 10-day cumulative ratio for stocks above 50MA is 1.99 now. A value >2 is good for swing trades on the long side.
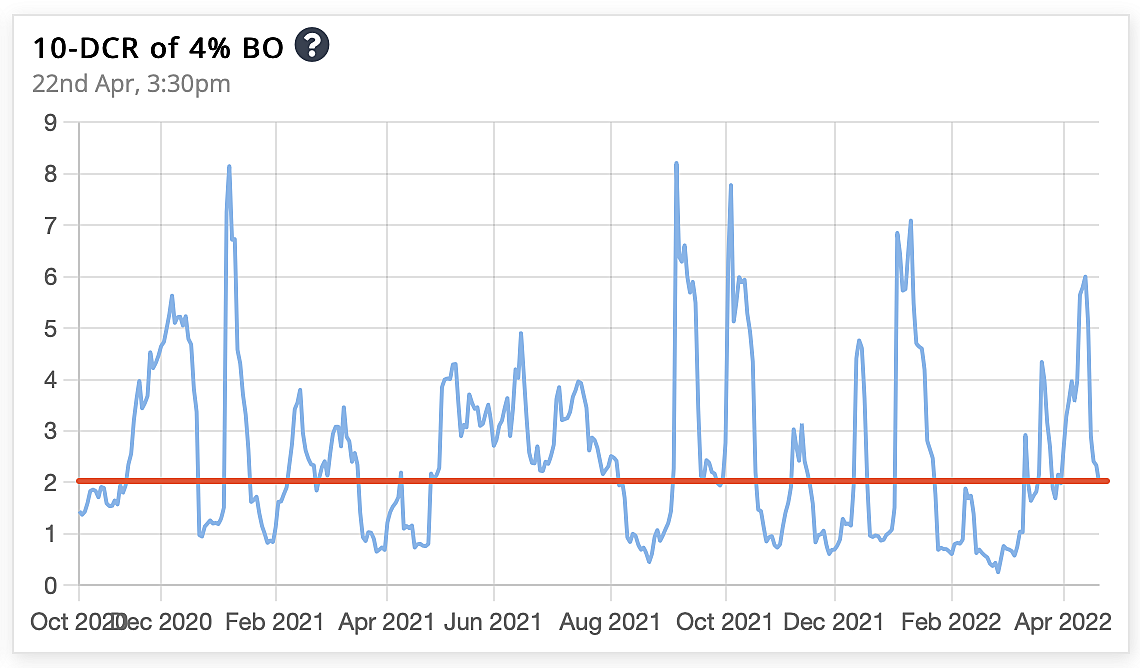
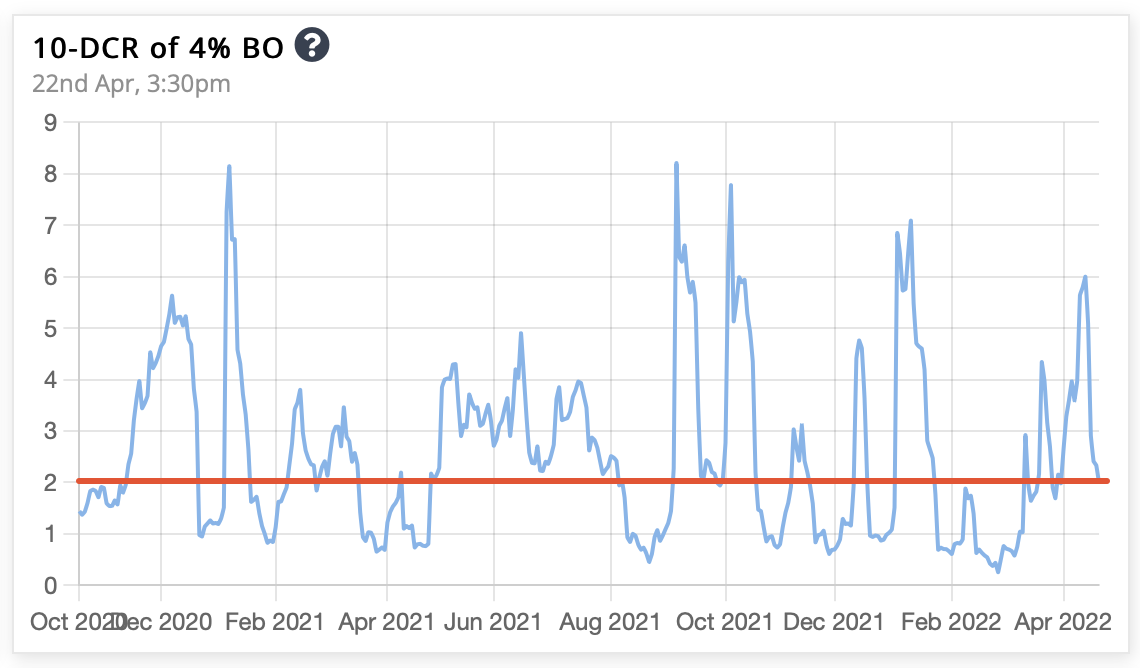
4% up/down in 1 day
The 10-day cumulative ratio between stocks up & down 4% in a day had been rising continuously & has now cooled down to reach its comfort value of 2.
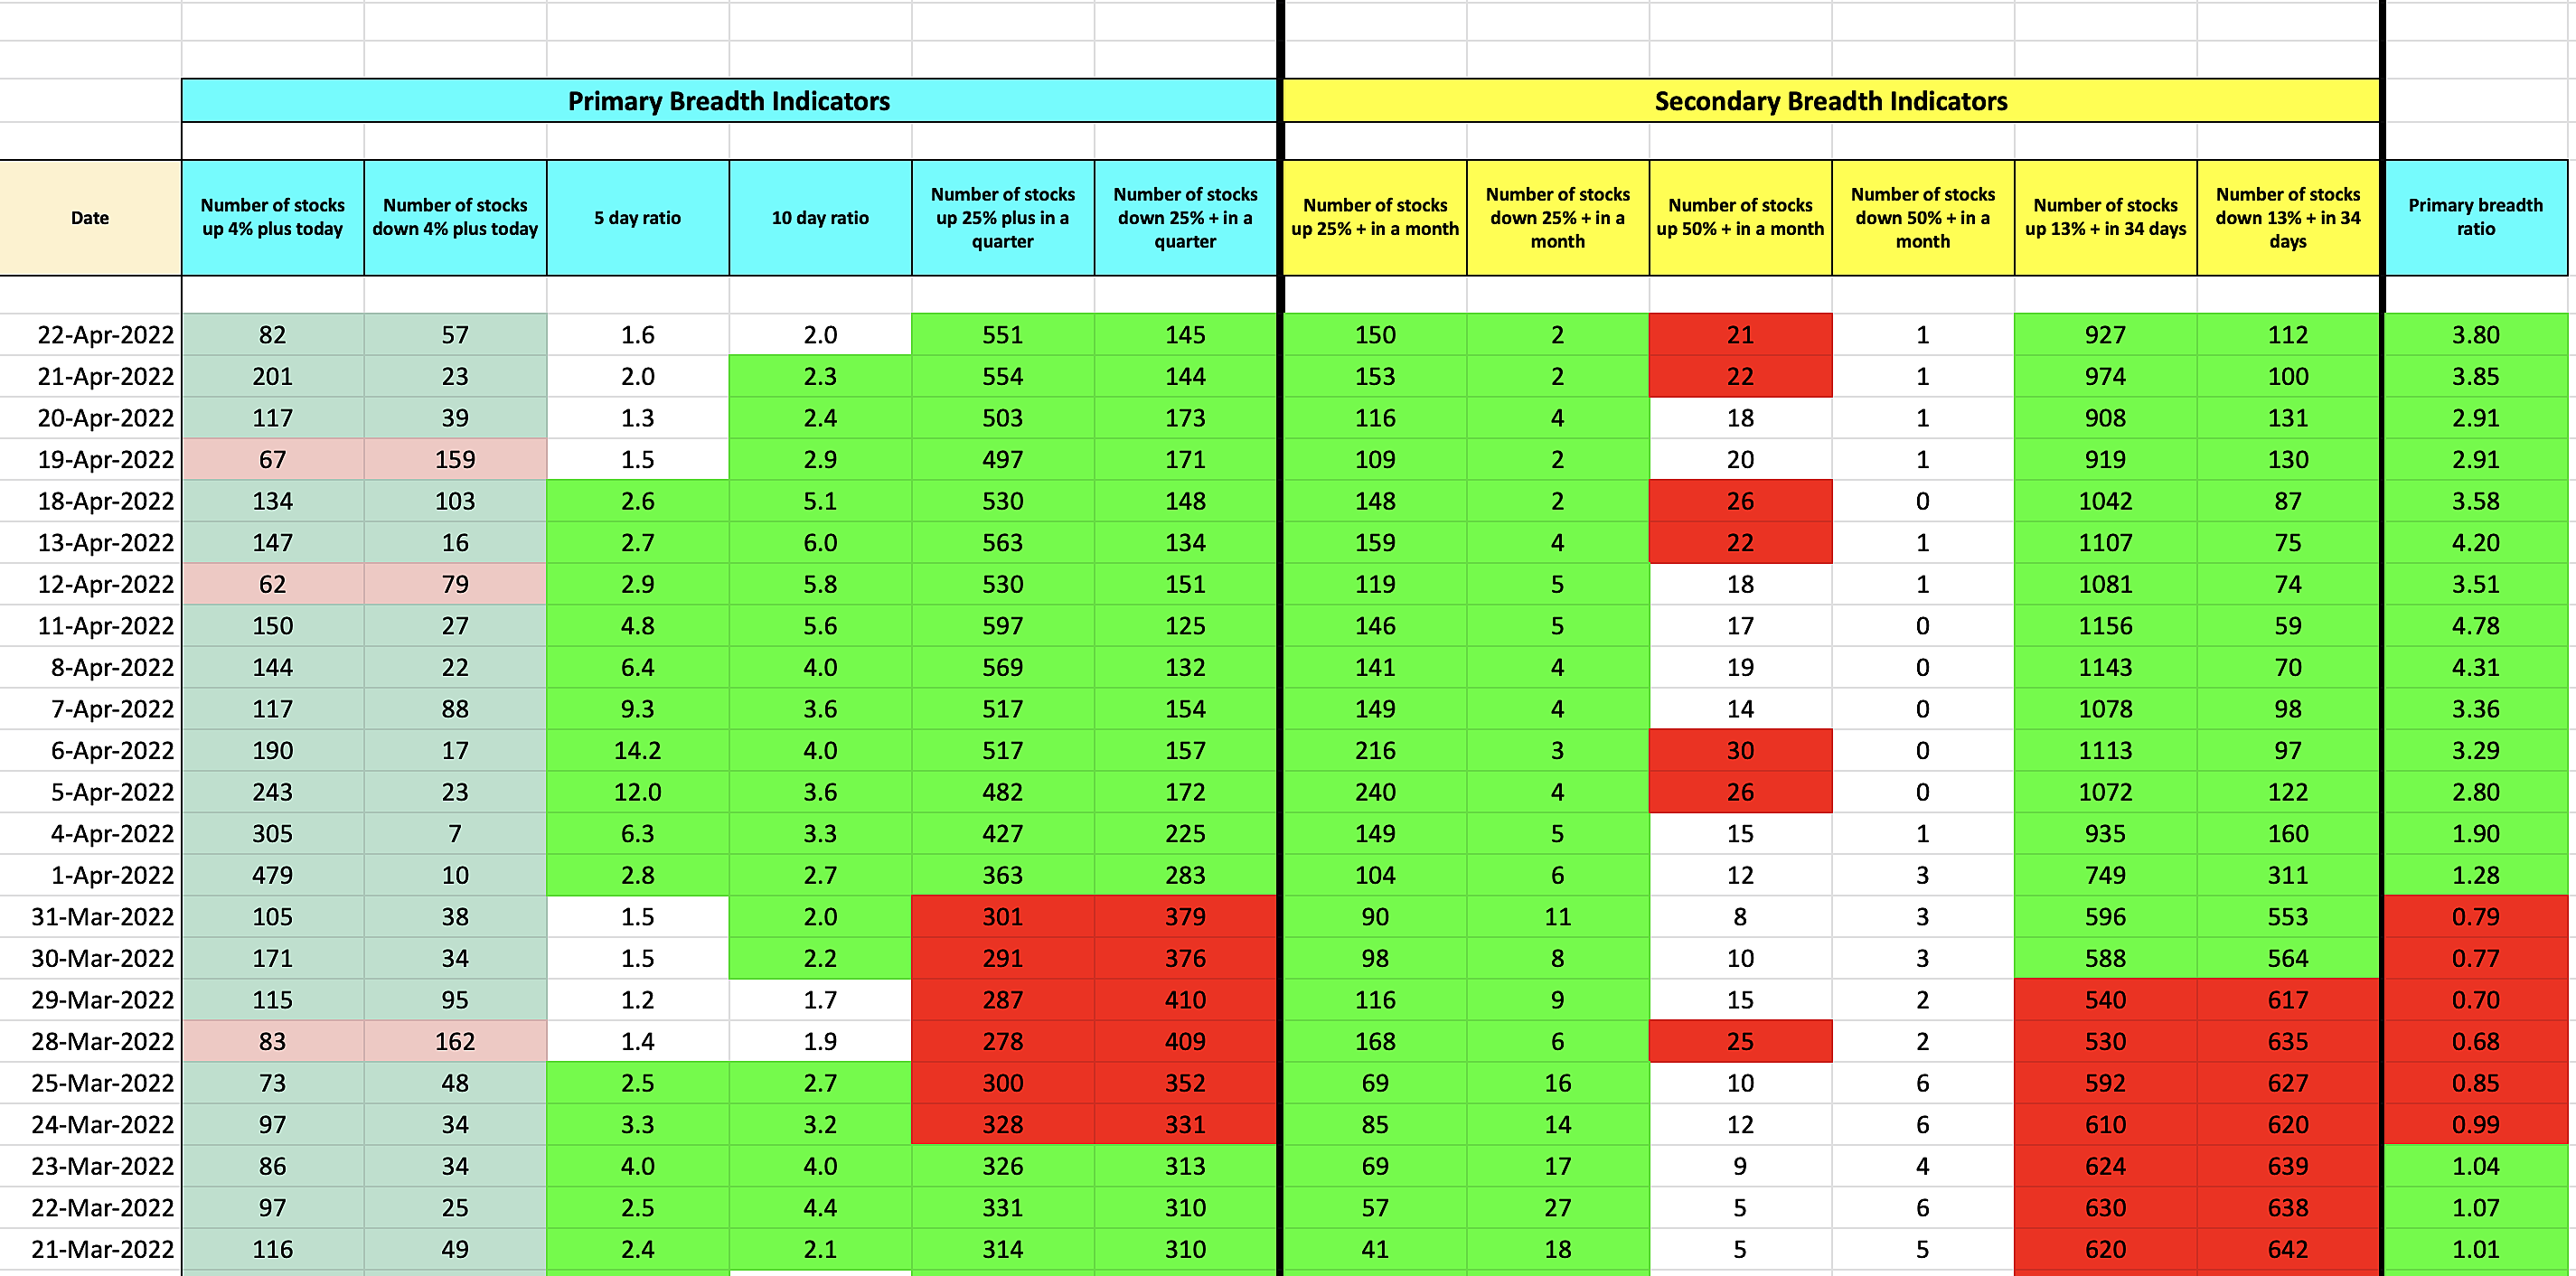
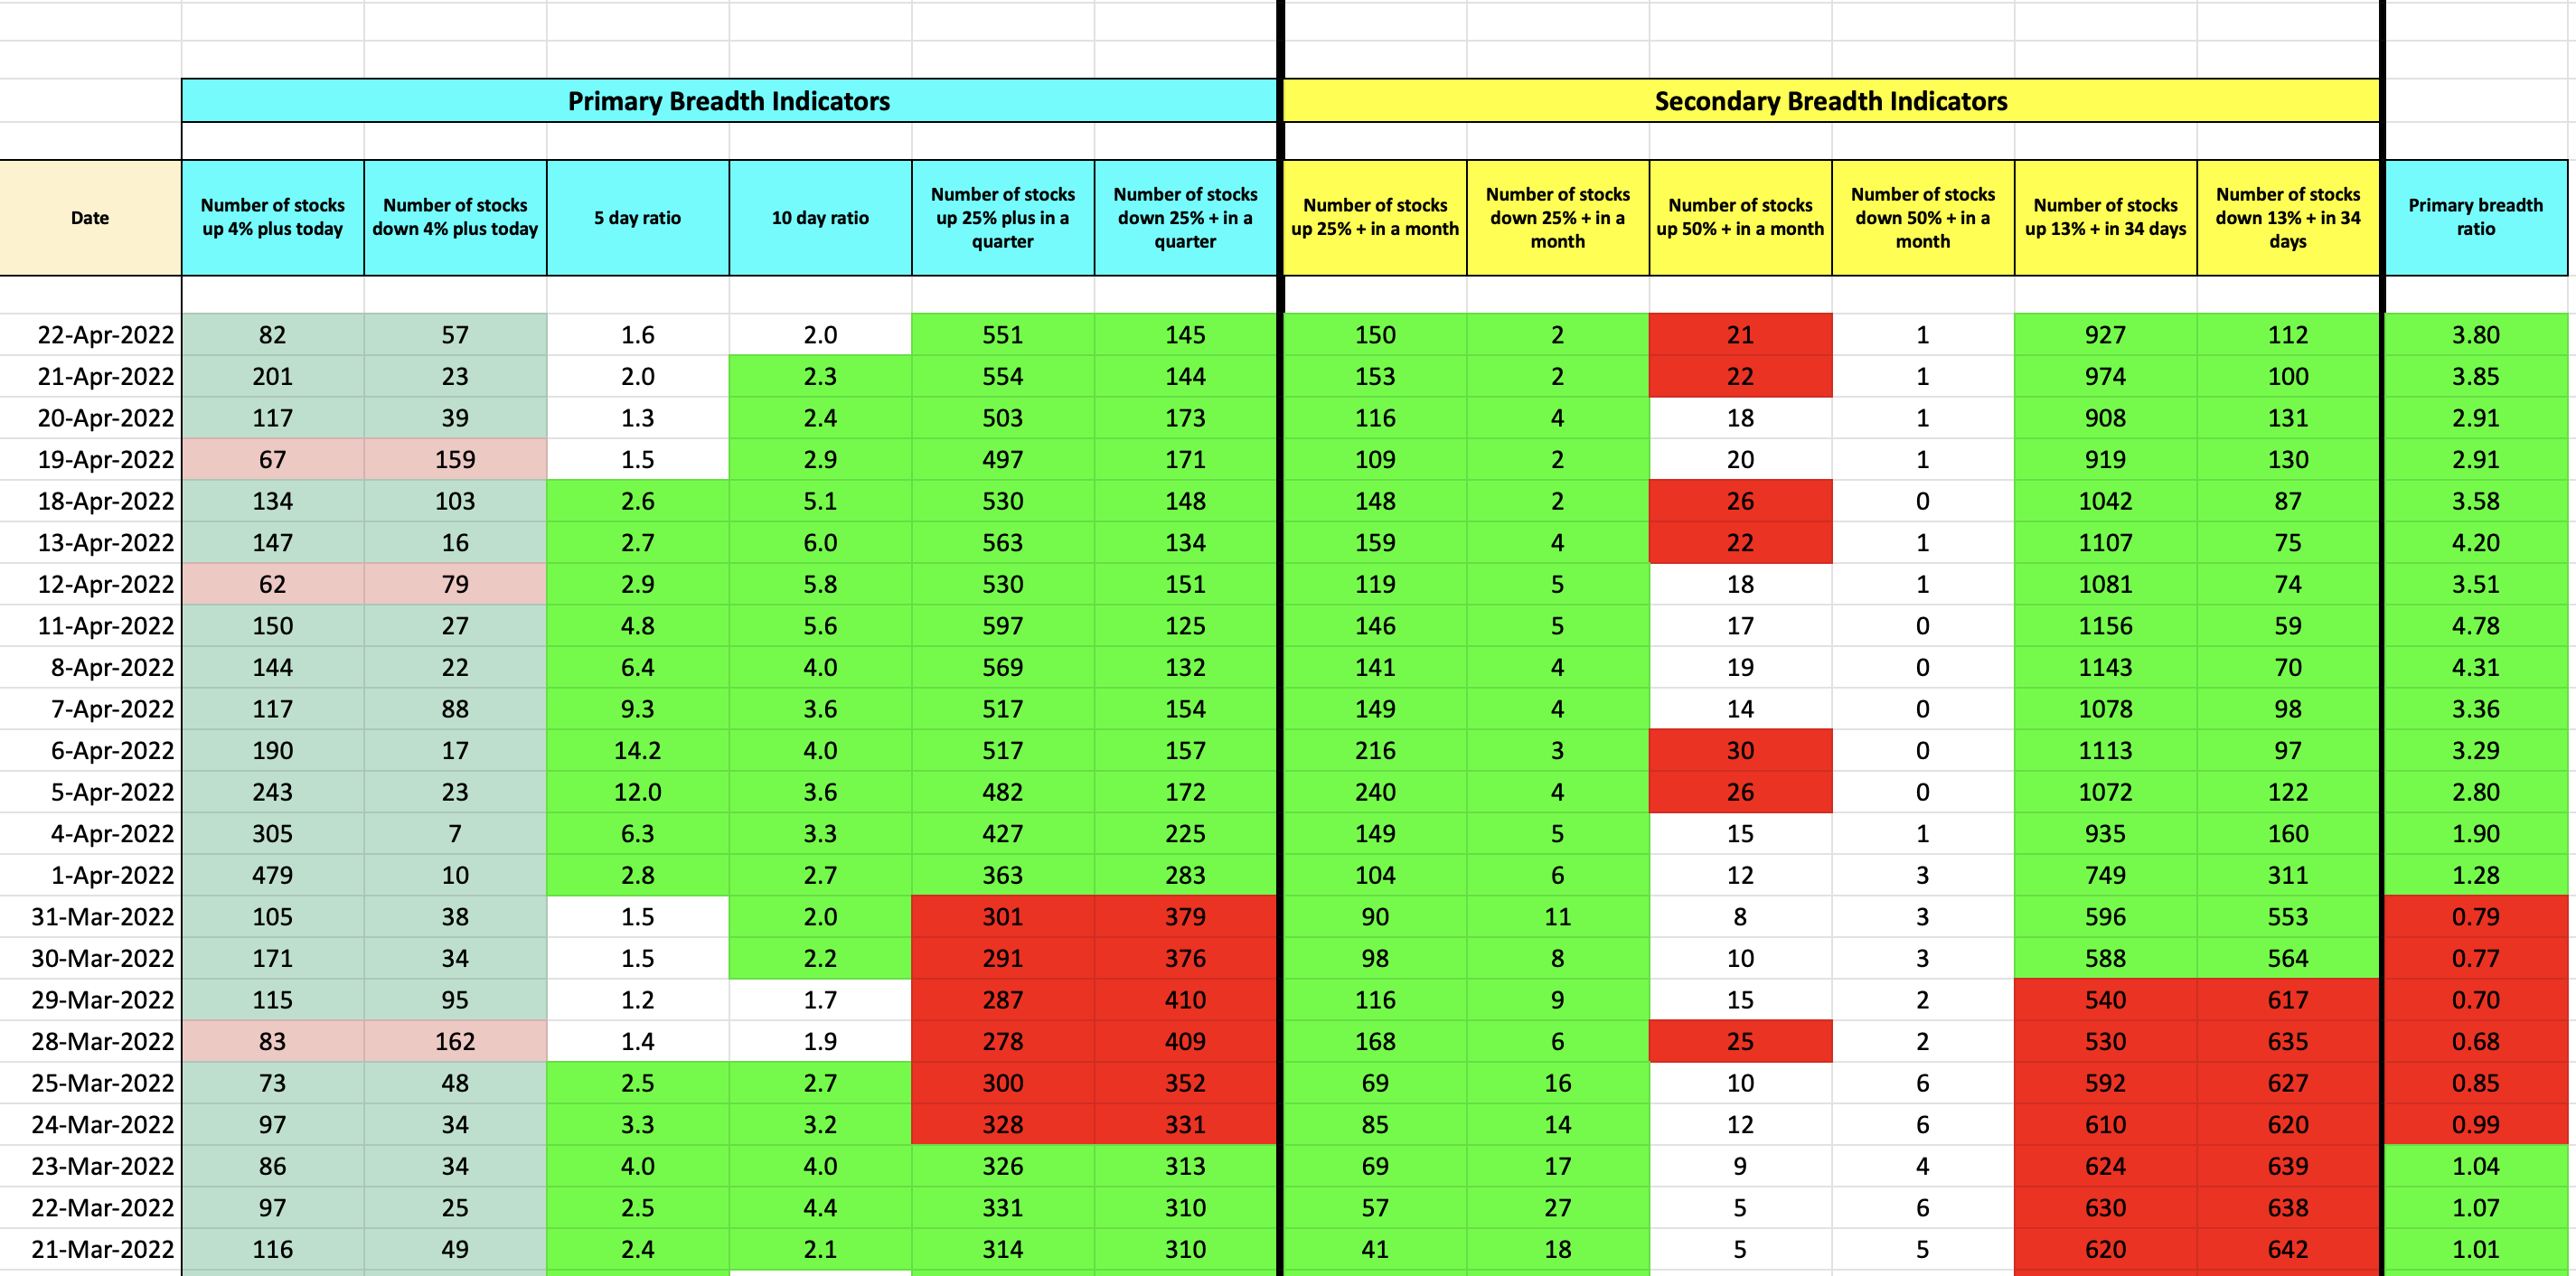
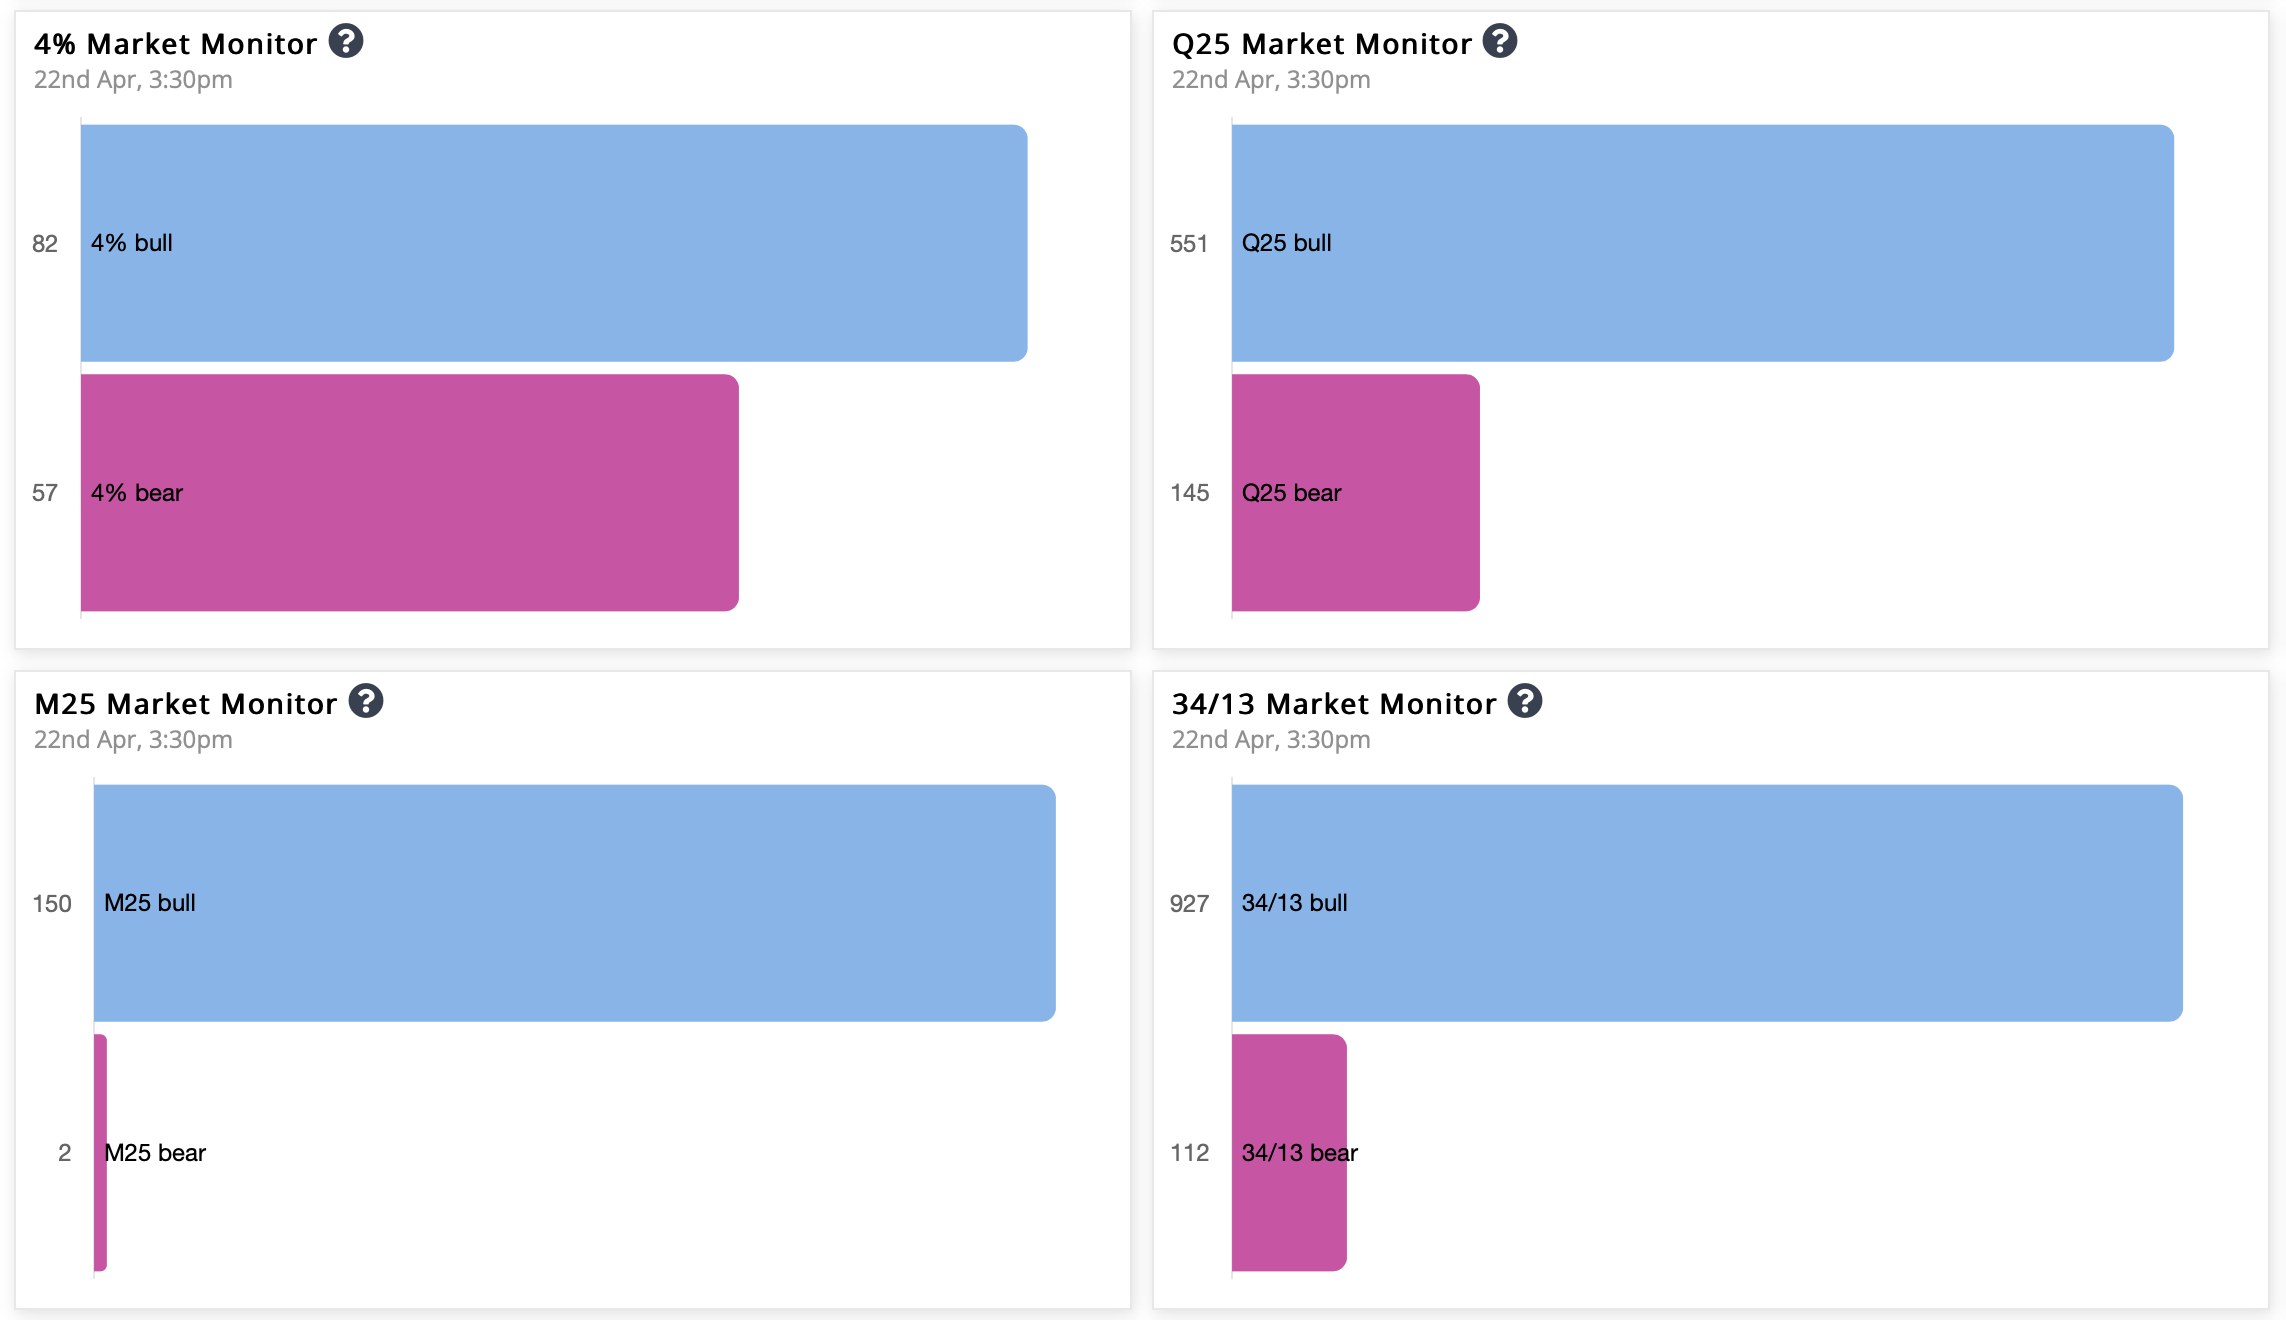
Stockbee Market Monitor
On a modified Stockbee market monitor, both the short-term indicator of 13% up in 34 days & the long-term metric of stocks 25% plus quarter stay positive.
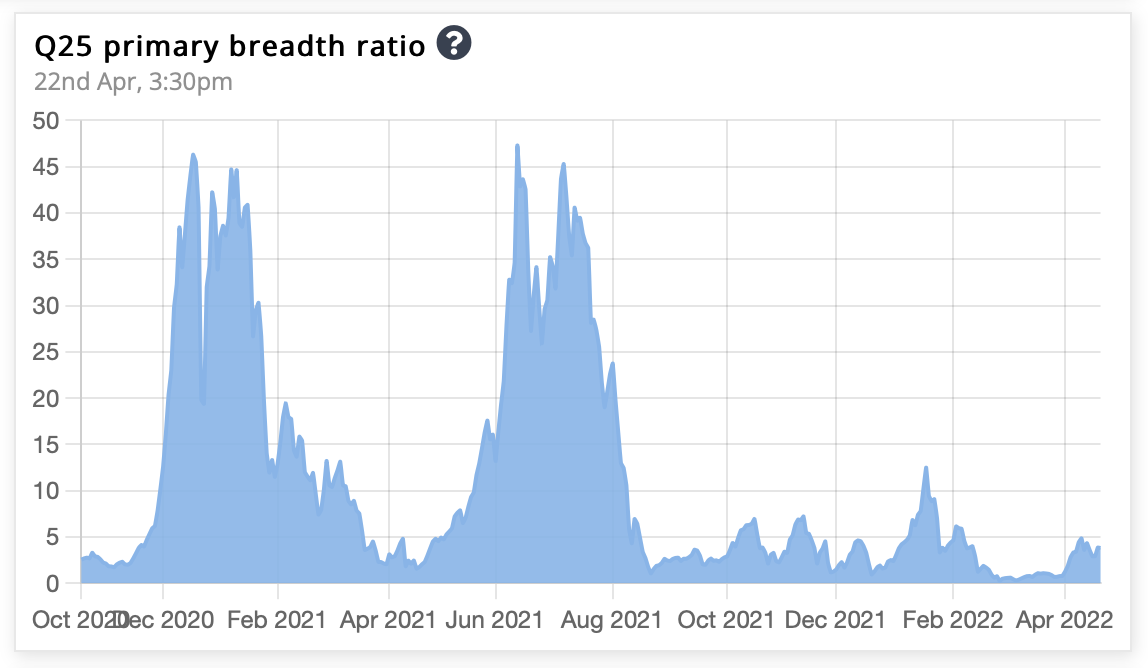
Primary Breadth Ratio
Overall, the market is bullish, as the number of stocks up 25% plus in a quarter is greater than that down 25% plus in a quarter. The ratio between the two is the primary breadth ratio, which is now 3.8.
That’s all for this week. If you'd like to know when I publish something new, just subscribe to my newsletter and you'll get the latest sent direct to you.
.png)
.png?disposition=attachment)