⦿ Breadth: Weakening, with higher timeframes bearish
⦿ Bias: Bullish on both long-term & short-term
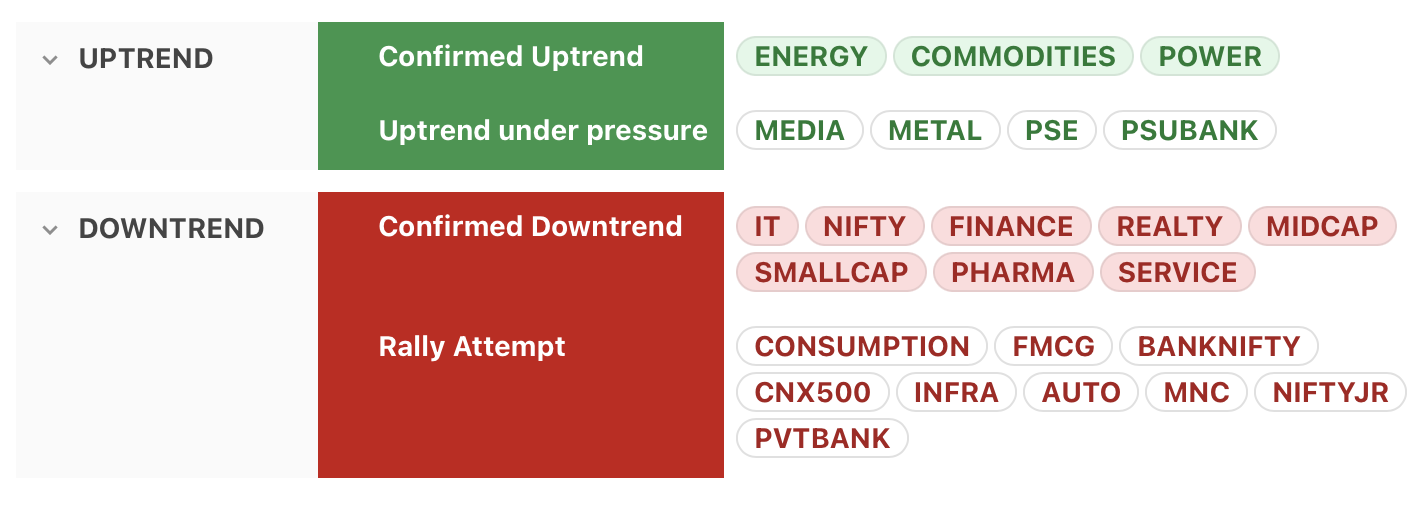
Trend
⦿ Most major indices are in downtrend.
⦿ Nifty, Midcap & Smallcap are in a confirmed downtrend.
⦿ PSUbank & Metals are now in Uptrend under pressure
⦿ Only Power, Commodities, & Energy in confirmed uptrend
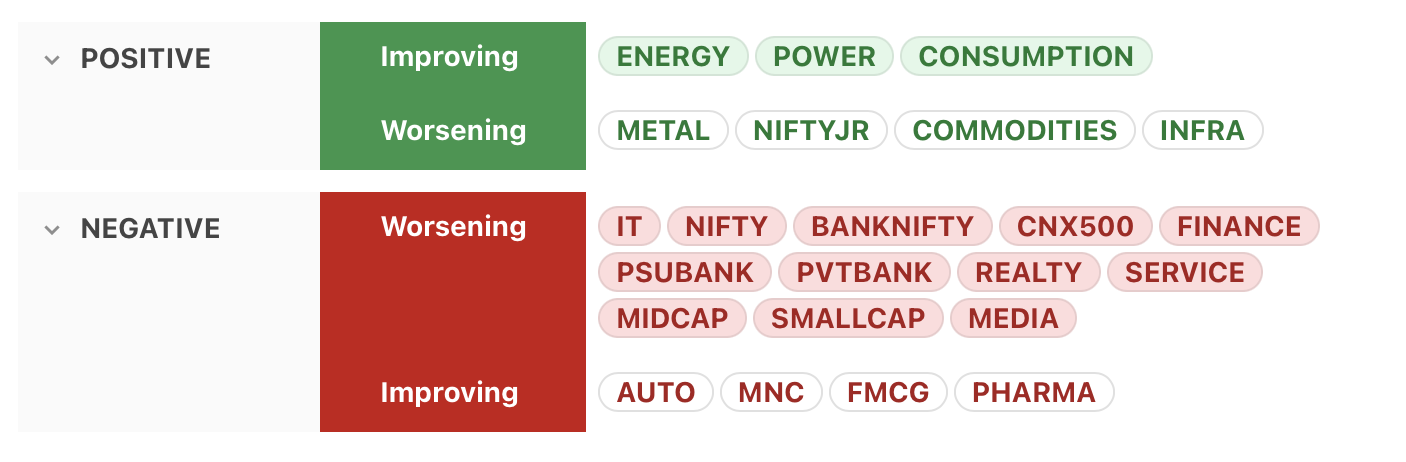
Momentum
⦿ Most major indices (Nifty, CNX500, Midcap, Smallcap) now have negative & worsening momentum.
⦿ Energy, Power, Consumption still have positive & improving momentum
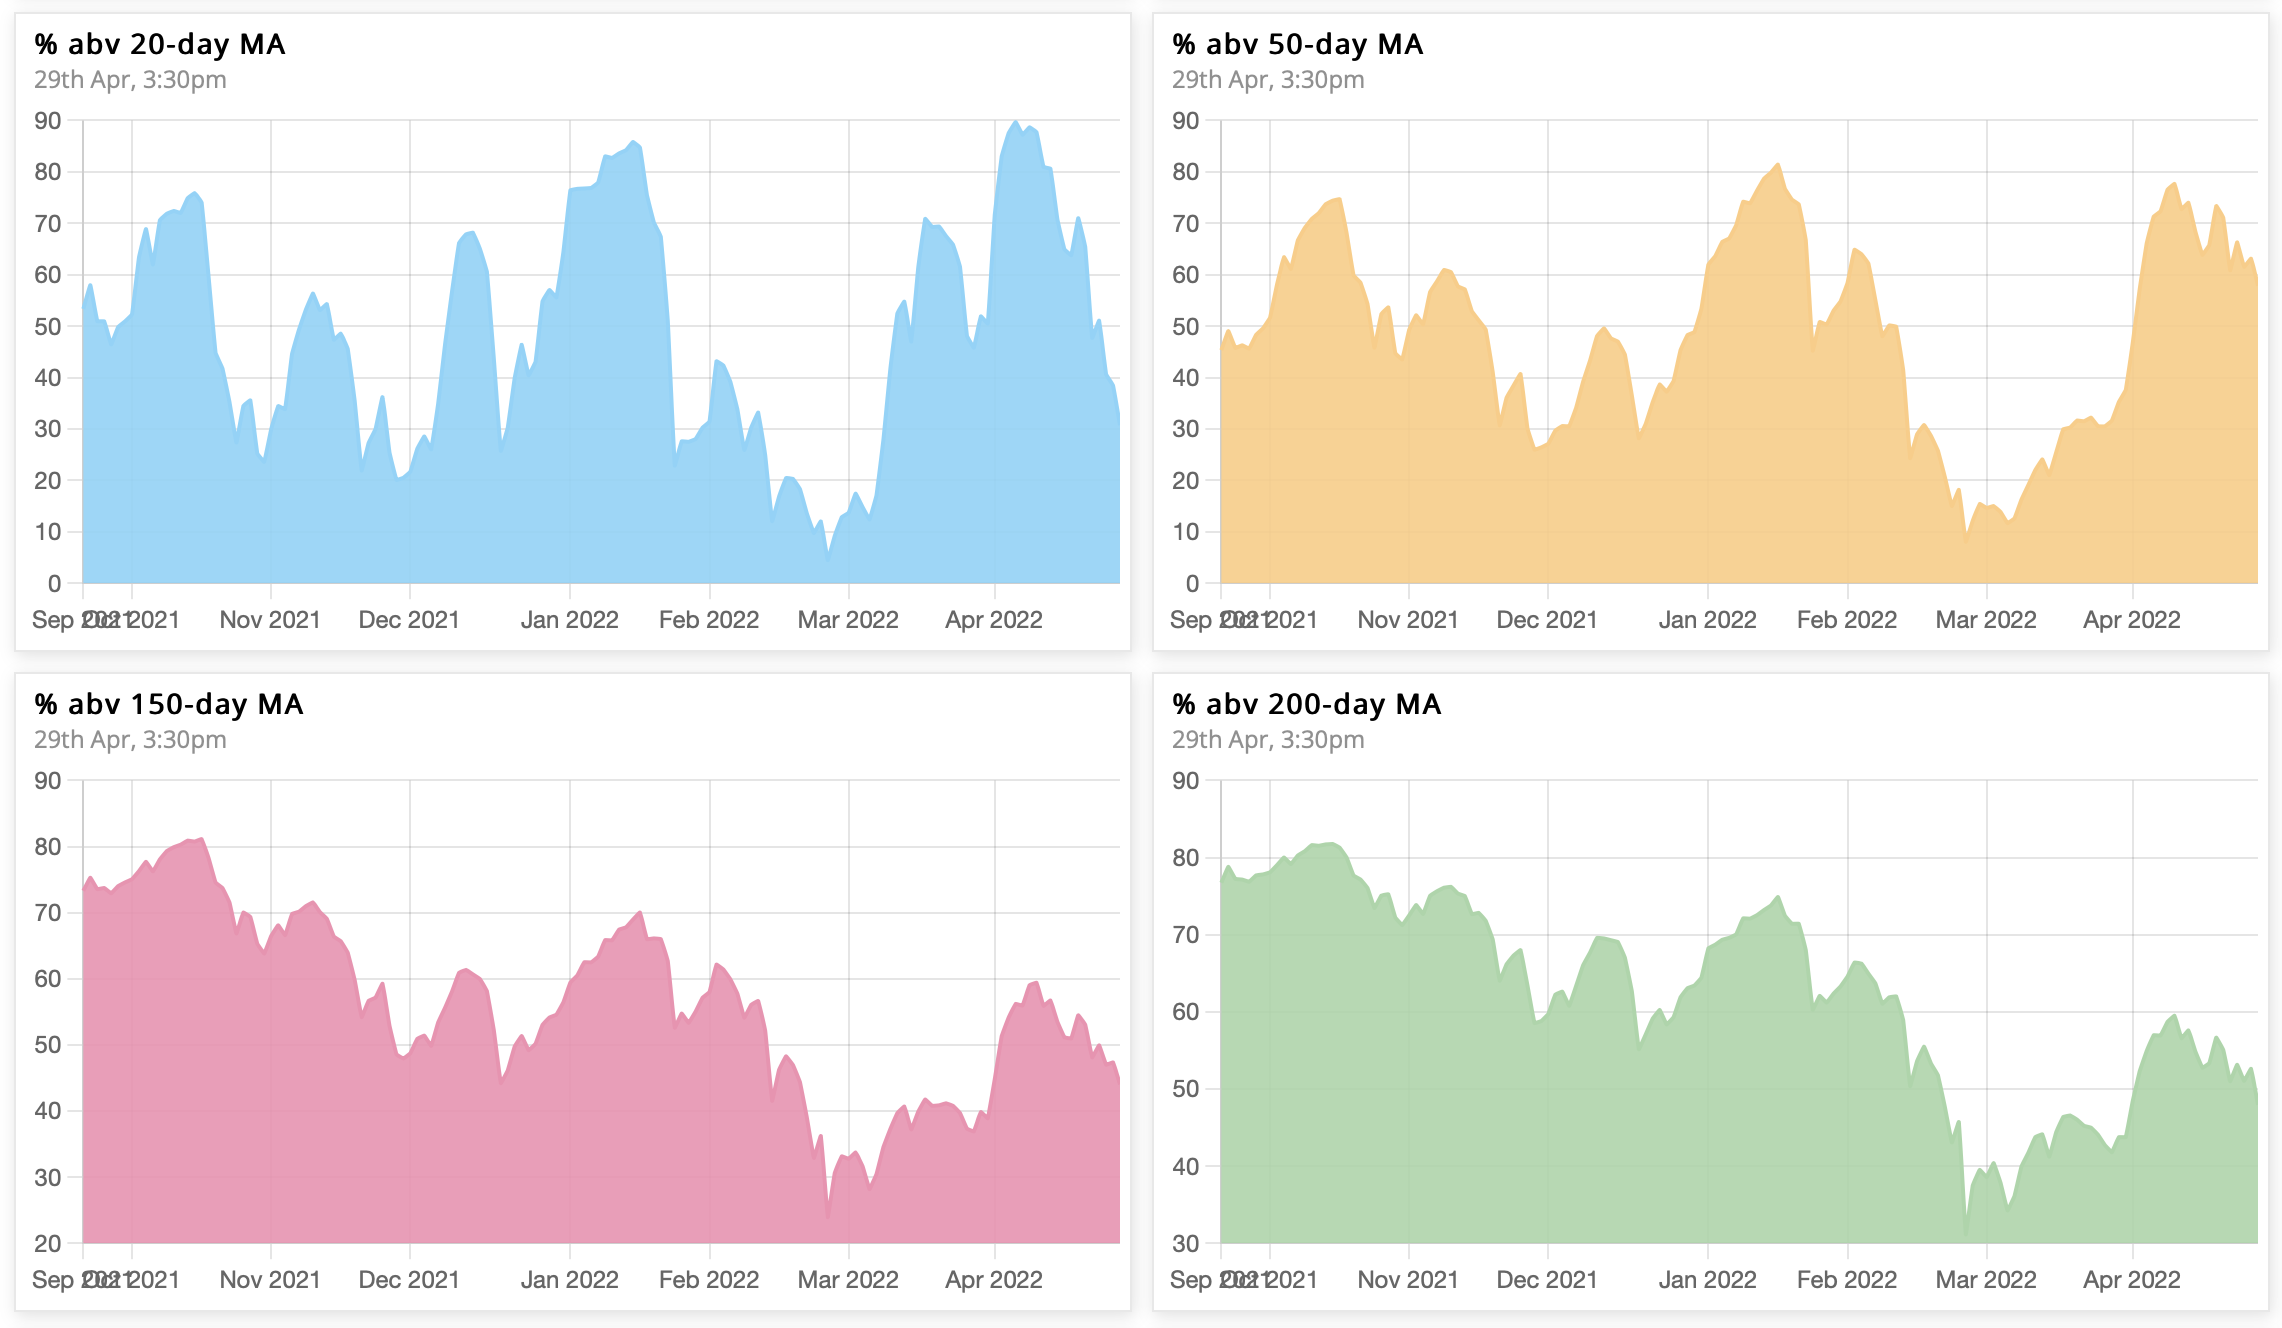
Market Breadth
Market breadth weakening on all timeframes. Higher timeframes now have weak bearish bias, while lower timeframes have no fresh buy signal.
⦿ 65% → 30% above 20 MA (nearing oversold)
⦿ 71% → 57% above 50 MA (neutral)
⦿ 53% → 44% above 150 MA (bearish bias)
⦿ 55% → 47% above 200 MA (bearish bias)
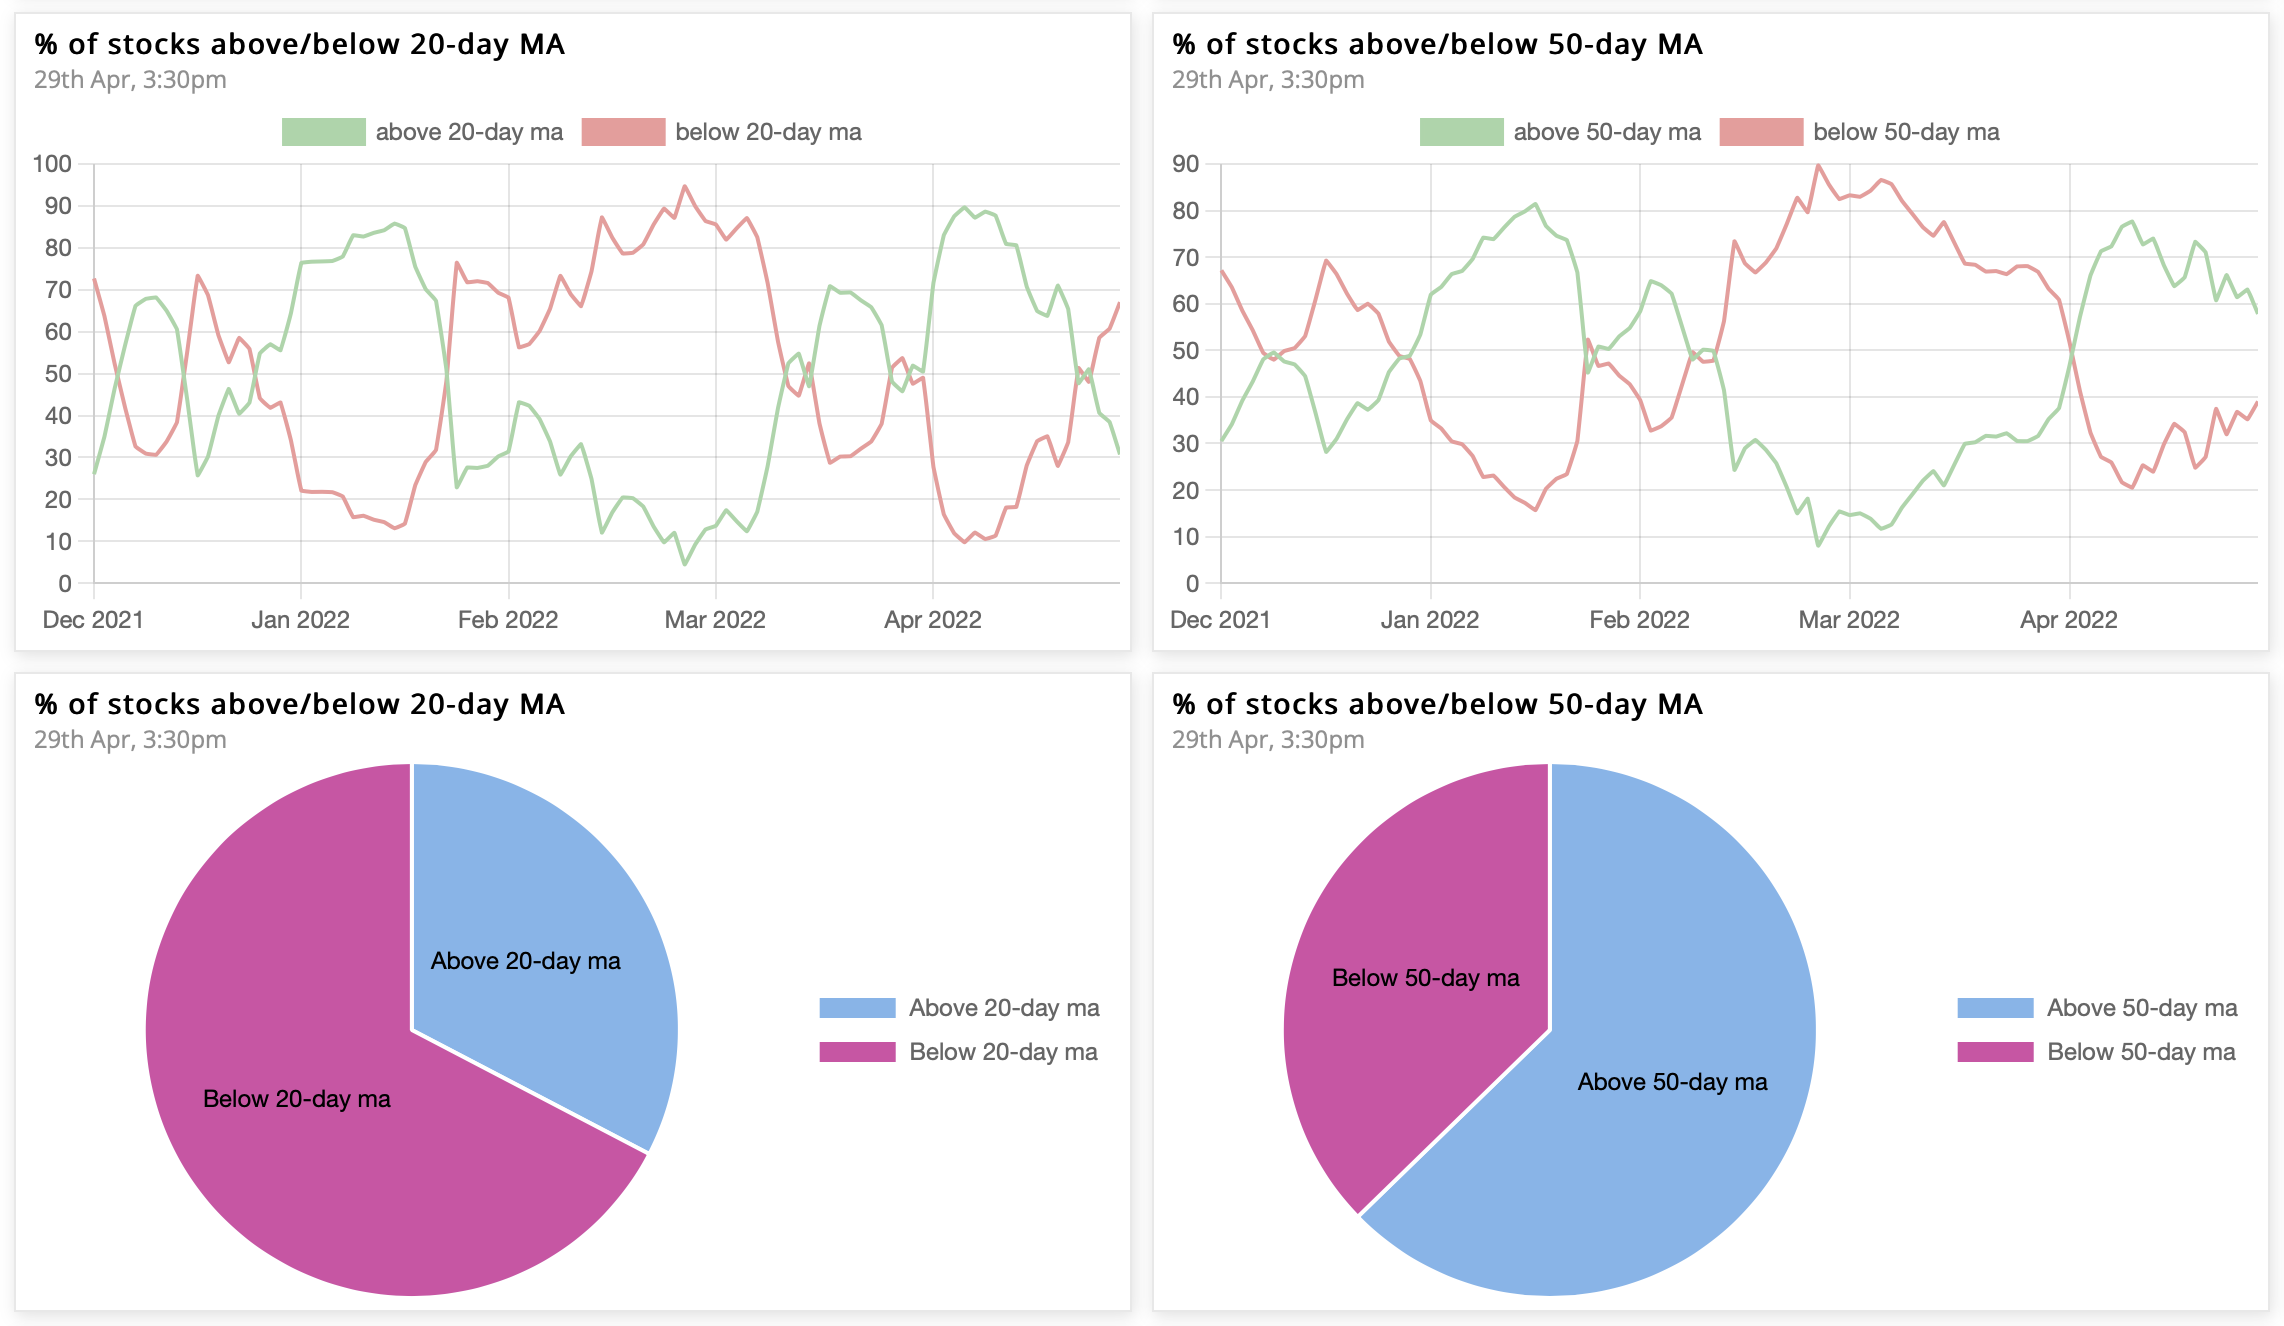
% of stocks above/below 20& 50MA
The Ratio between stocks above & below 50MA is 1.6, while that for 20MA is 0.4.
The 10-day cumulative ratio for stocks above 50MA is 1.6 now. A value >2 is good for swing trades on the long side.
Bias
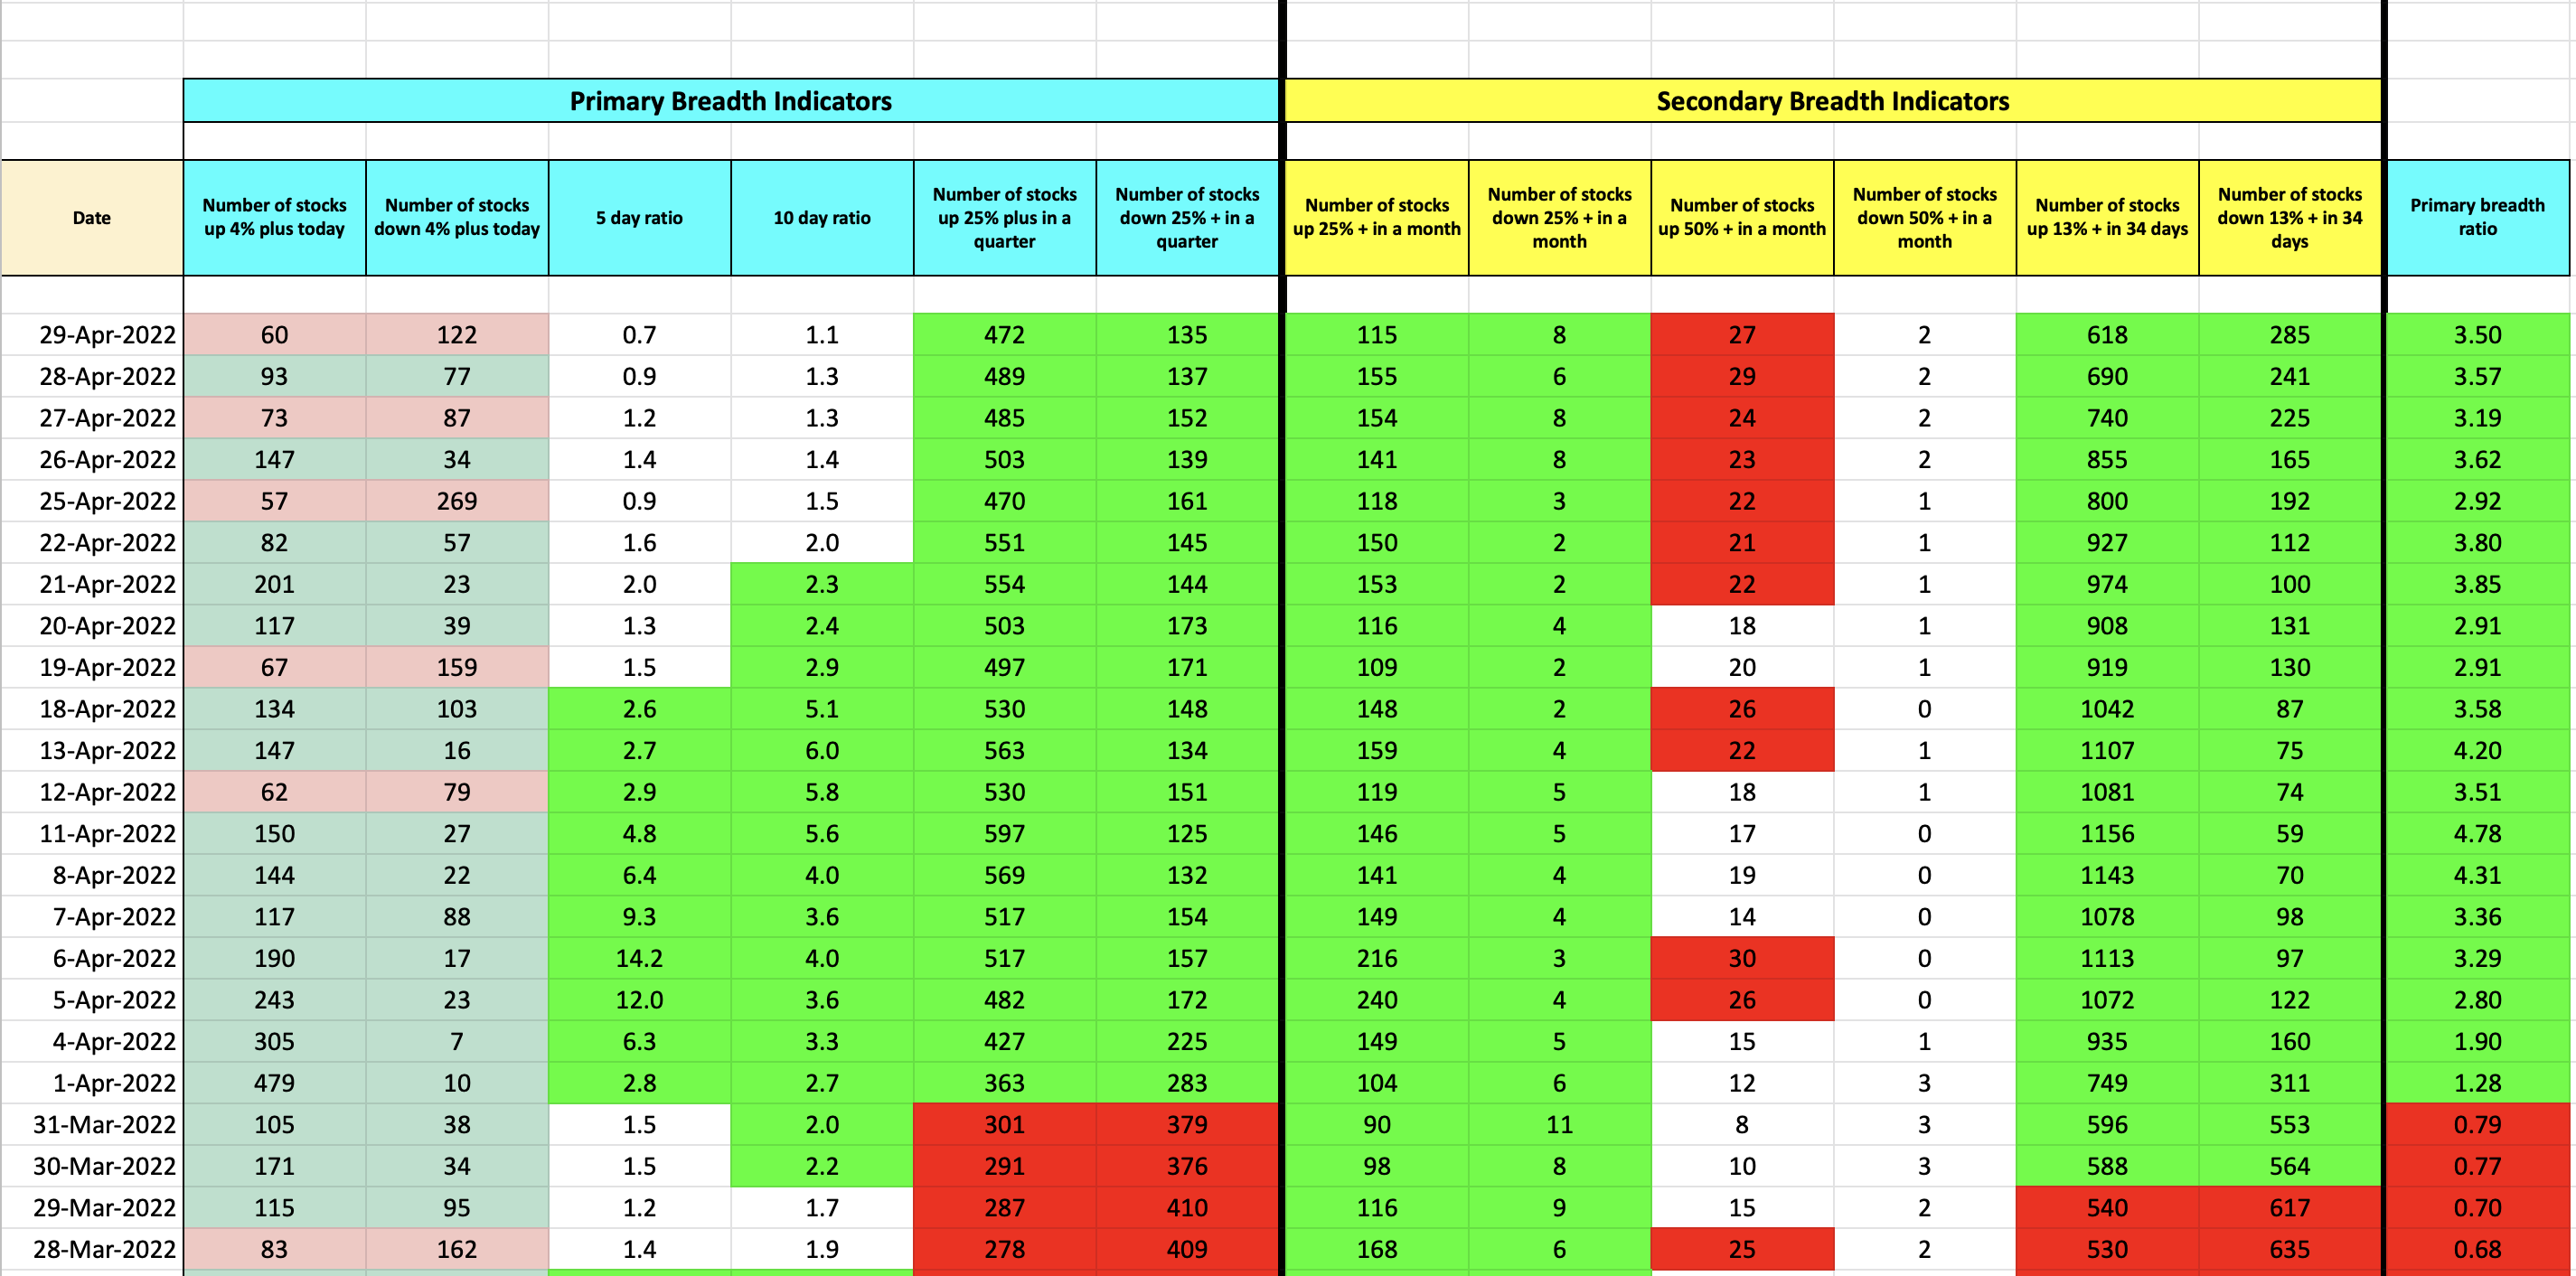
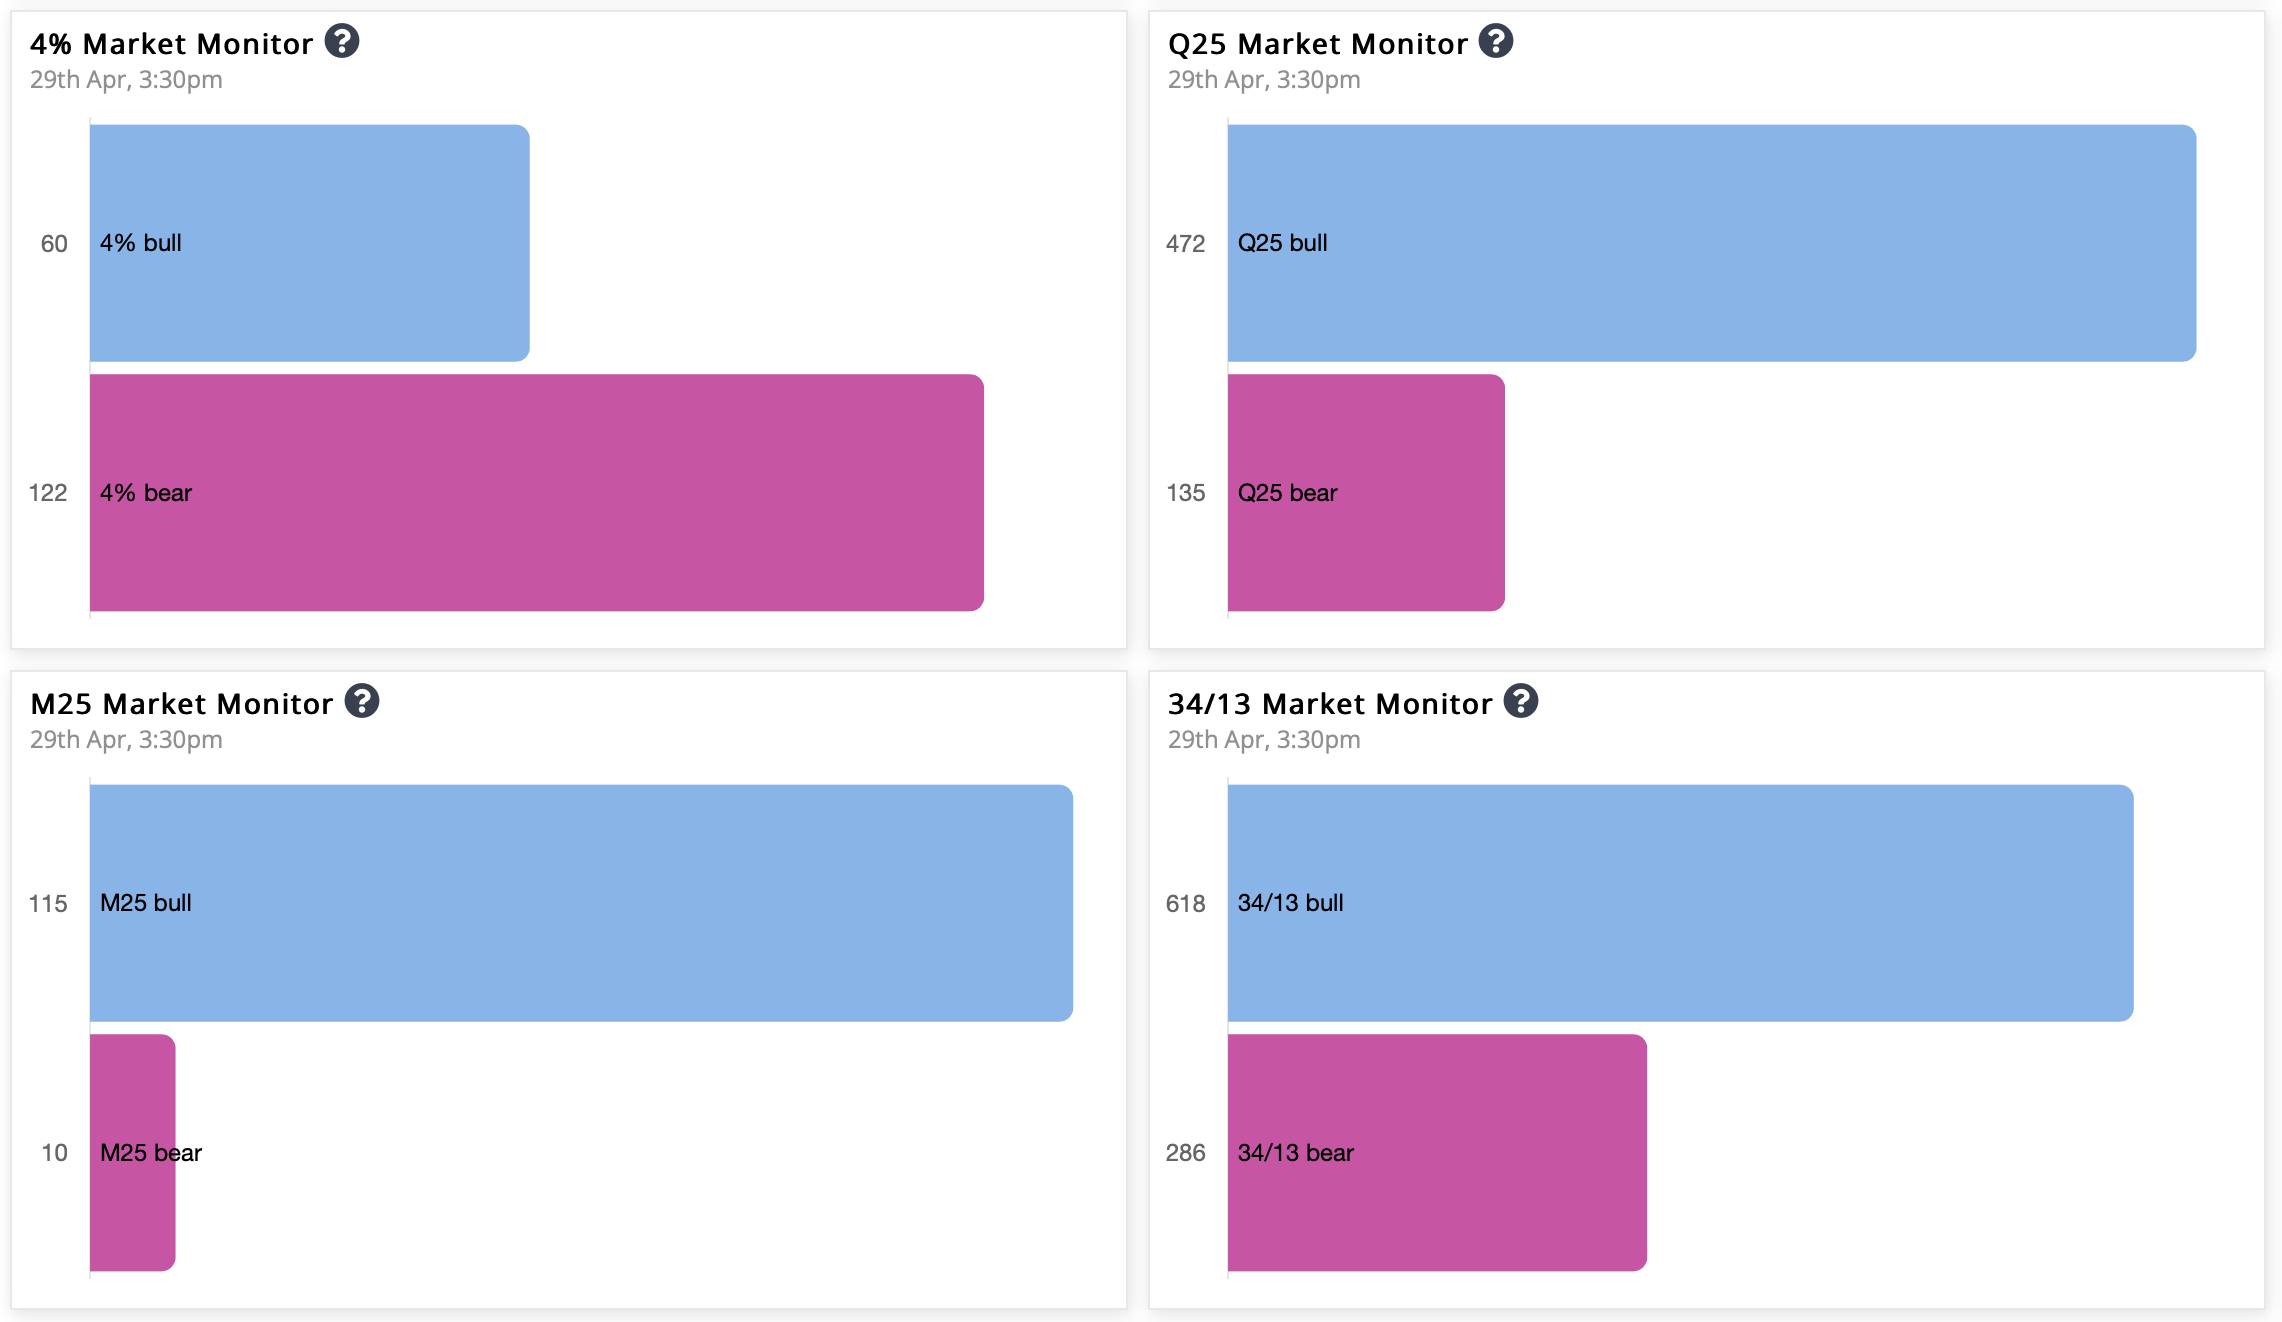
On a modified Stockbee market monitor, both the short-term indicator of 13% up in 34 days & the long-term metric of stocks 25% plus quarter stay positive.
4% up/down in 1 day
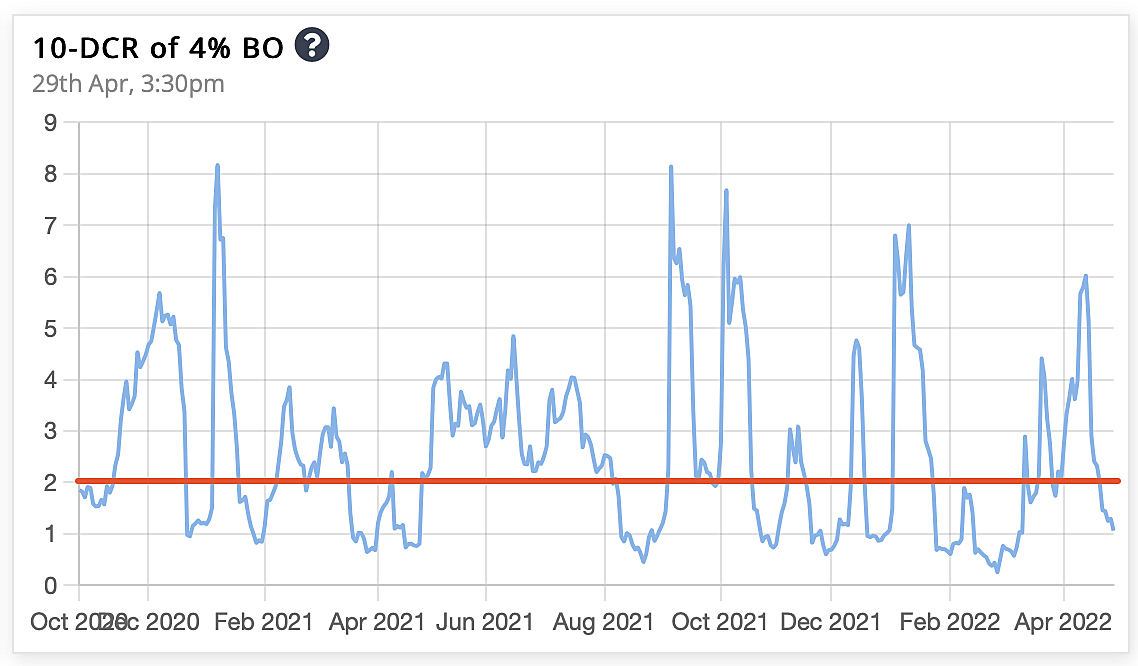
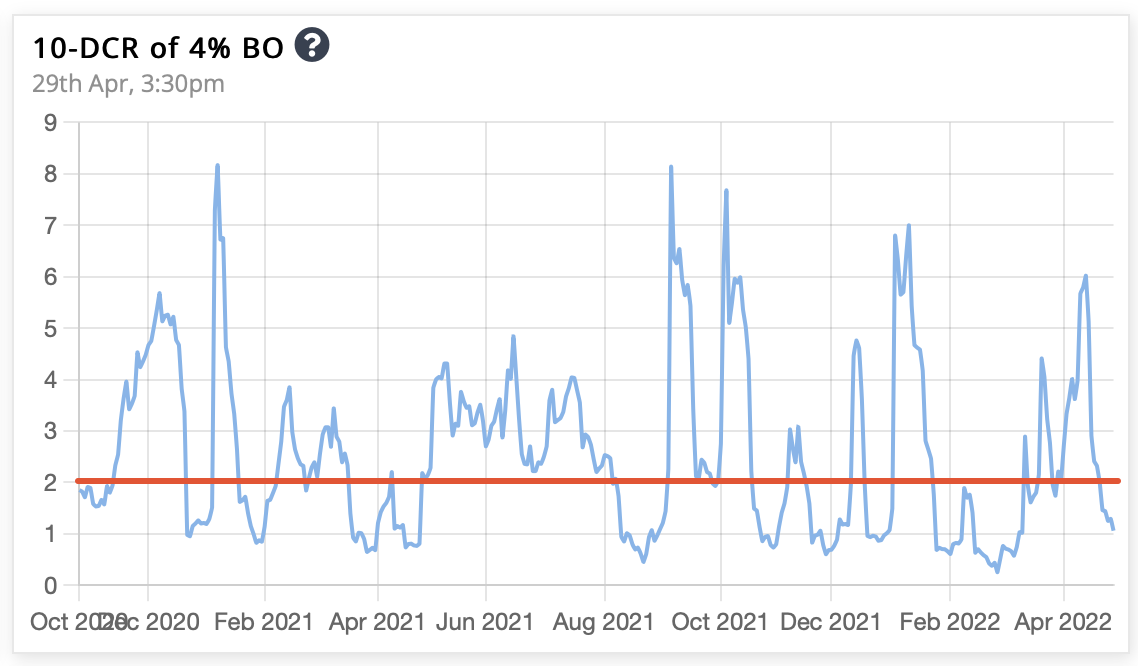
The 10-day cumulative ratio (10-DCR) between stocks up & down 4% in a day is now below 2.
When market is in bearish phase, a fresh bull move starts when 10-DCR first time crosses above 2.
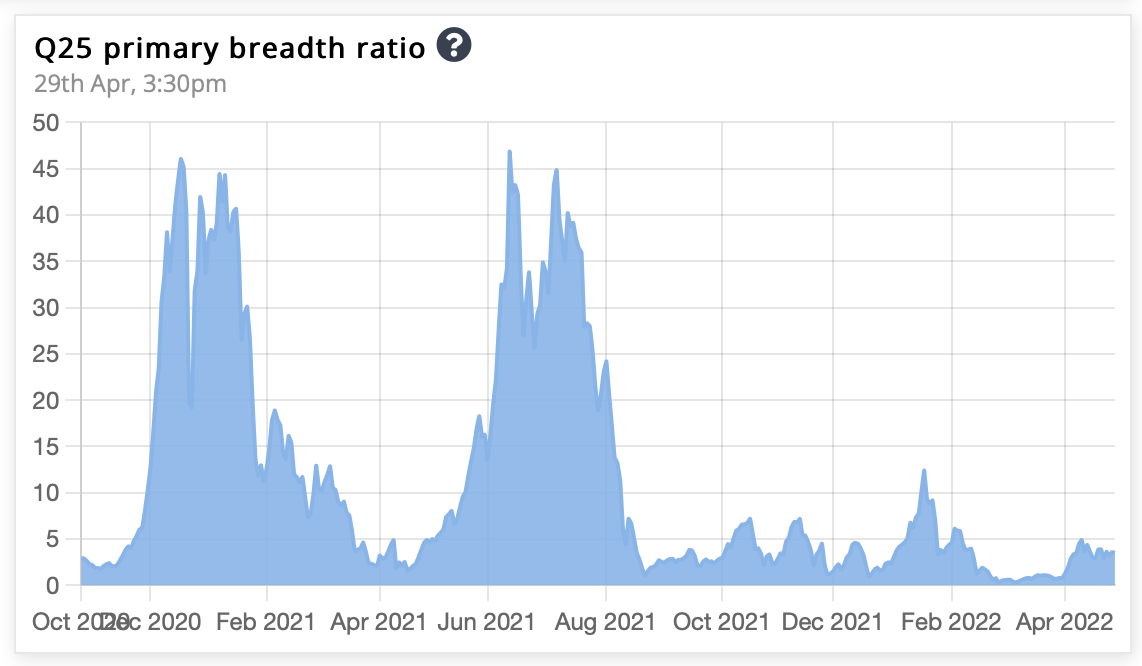
Primary Breadth Ratio
Overall, the market is bullish, as the number of stocks up 25% plus in a quarter is now greater than that down 25% plus in a quarter. The ratio between the two is the primary breadth ratio, which is now 3.5.
That’s all for this week. If you'd like to know when I publish something new, just subscribe to my newsletter and you'll get the latest sent direct to you.
.png)
.png?disposition=attachment)