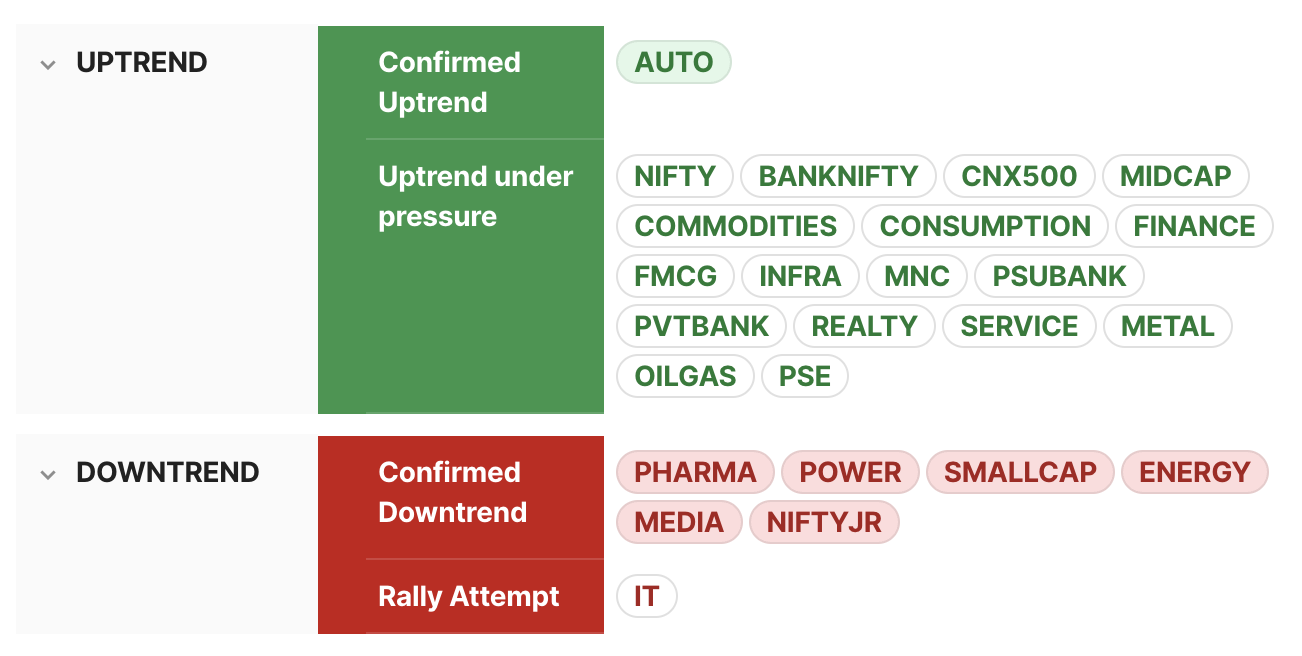
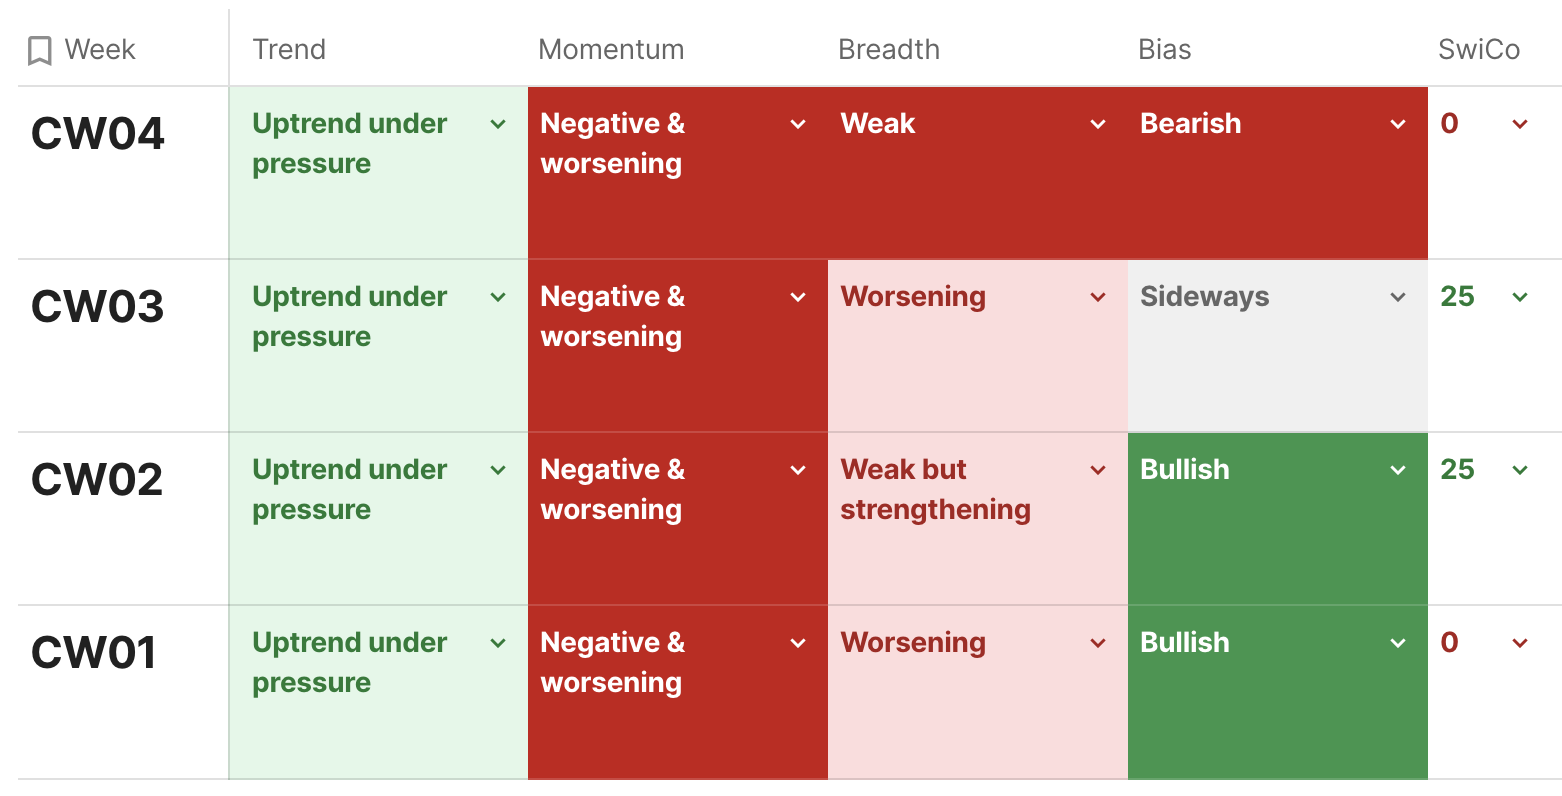
⦿ Most indices stay in uptrend under pressure. ⦿ NiftyJr & Smallcap indices are in confirmed downtrend. ⦿ Auto is the only index in a confirmed uptrend.
Momentum
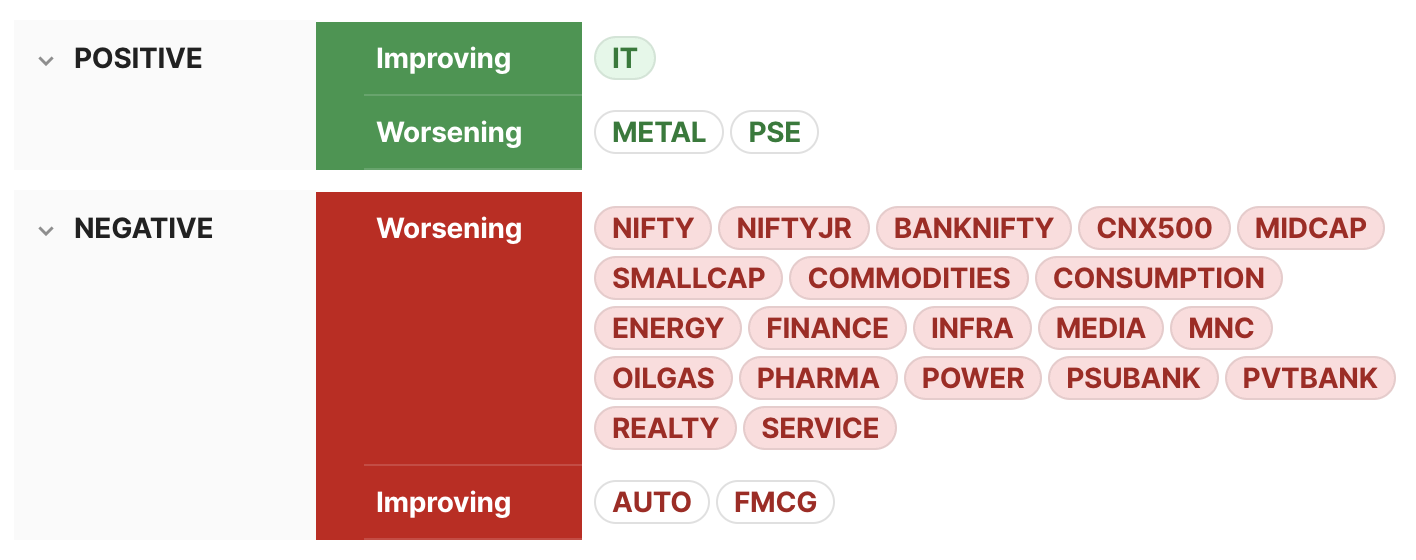
⦿ Almost all major indices have negative & worsening momentum. ⦿ IT is the only index with positive & improving momentum. ⦿ PSE & Metals have positive but worsening momentum.
Swing
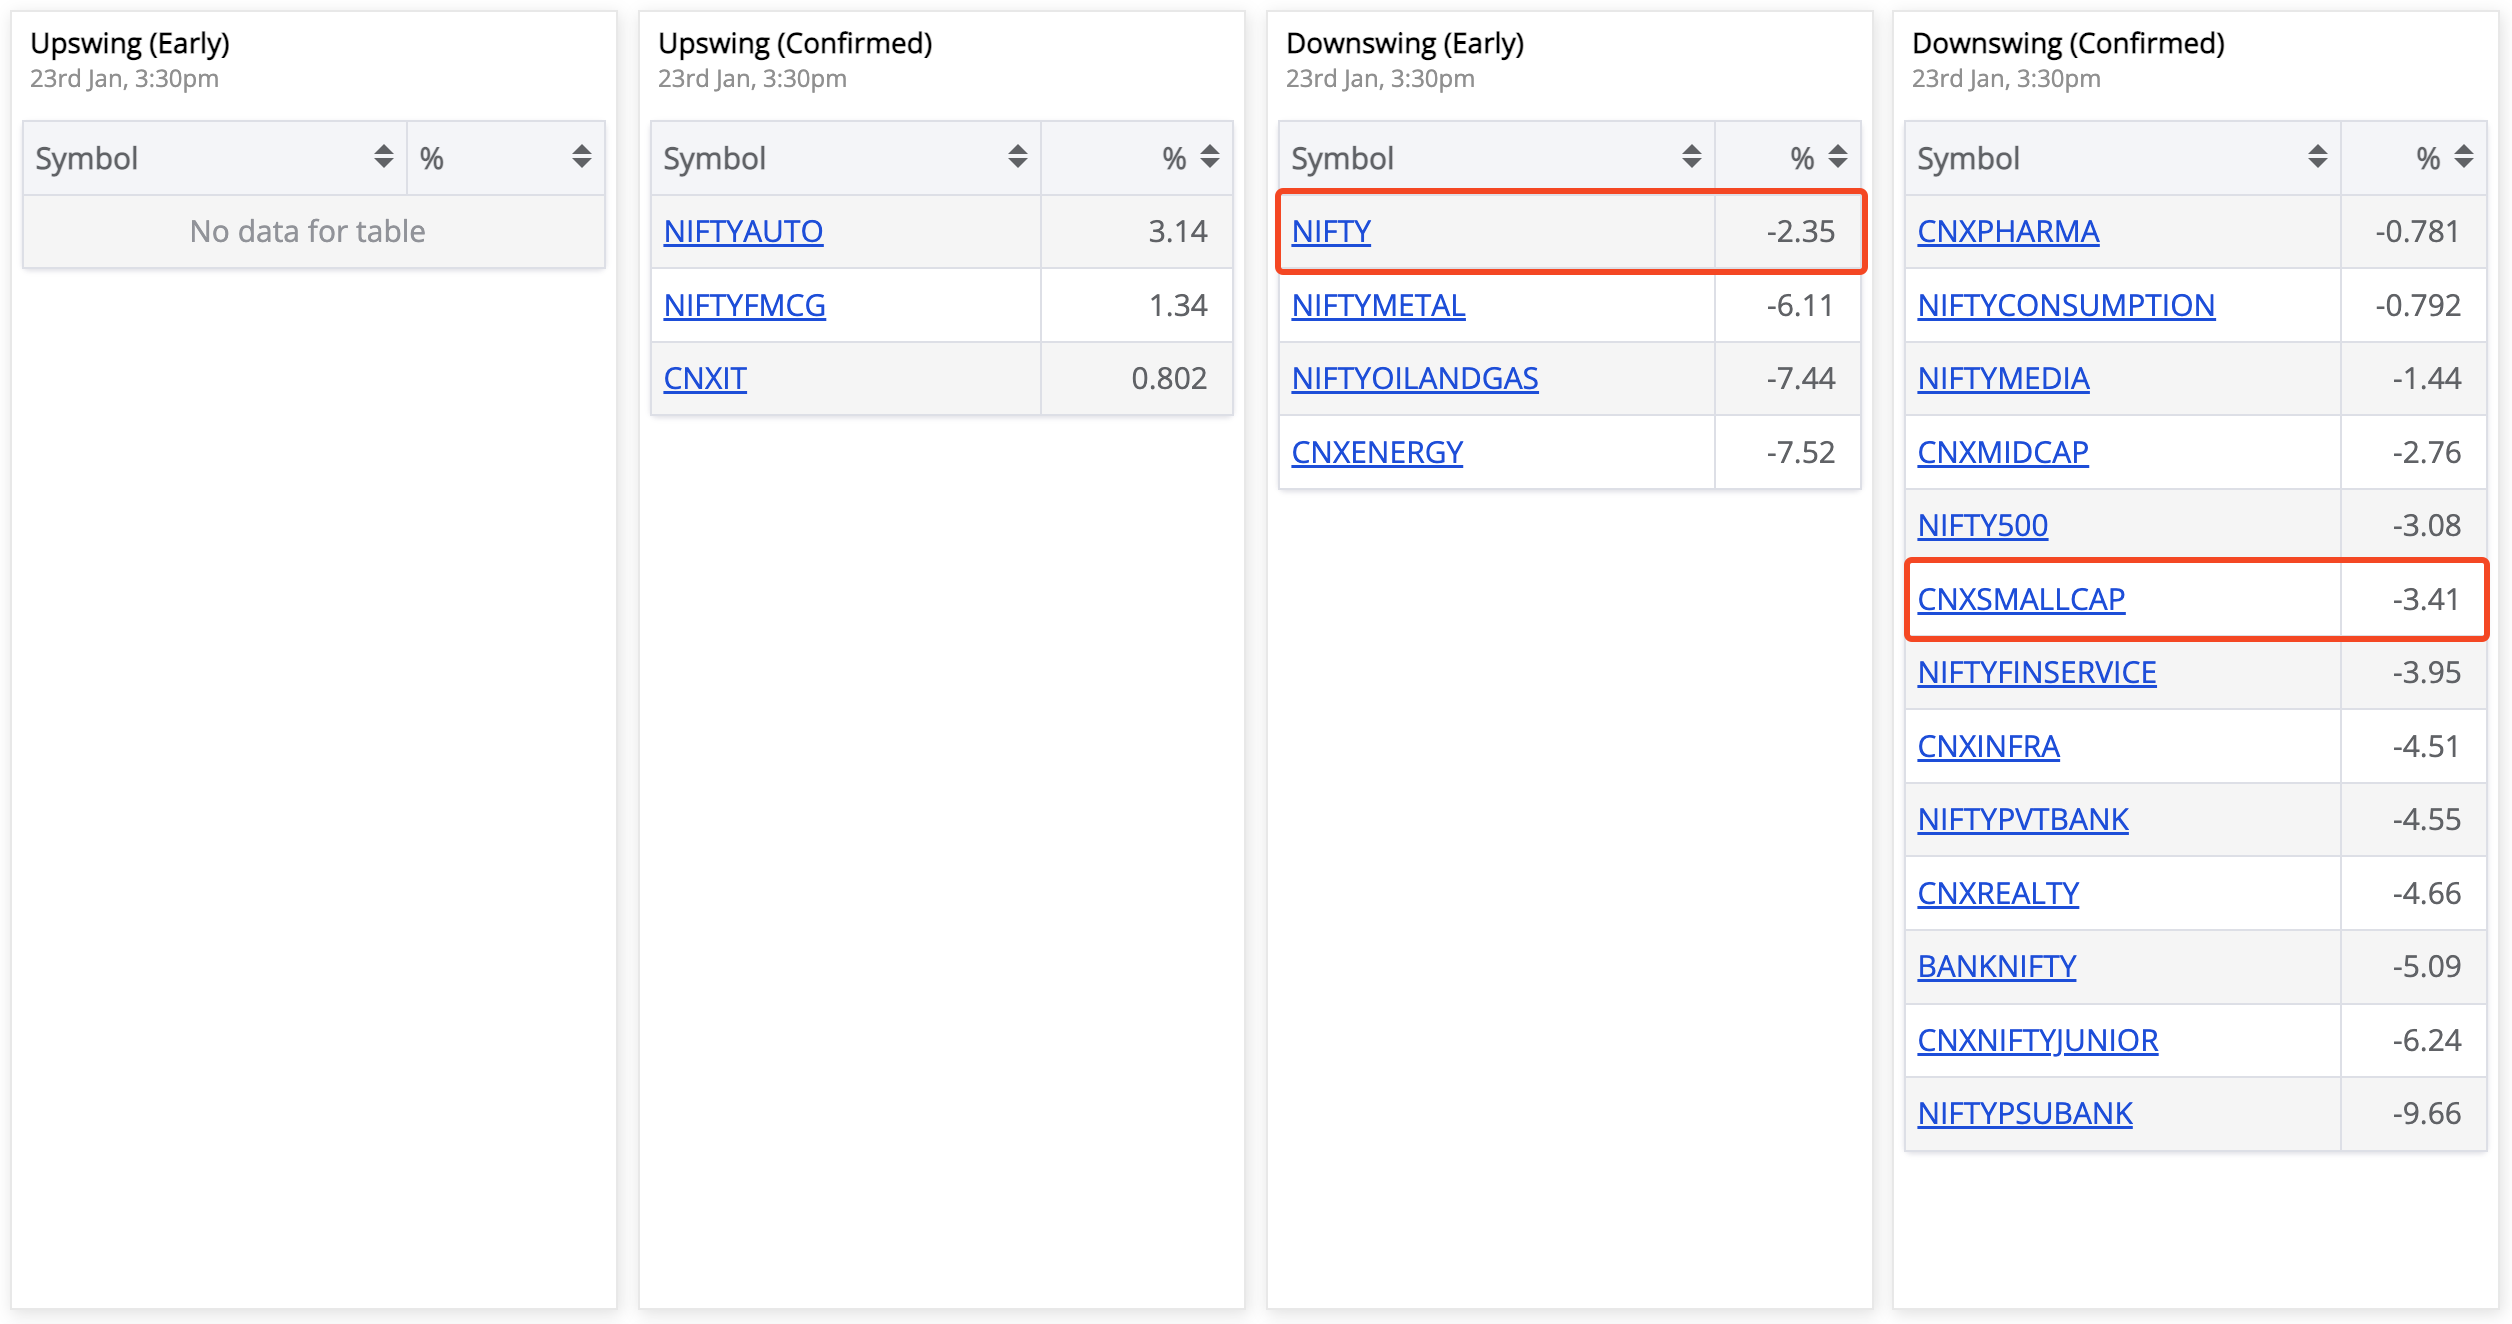
⦿ While Nifty is in early downswing, Smallcap is in a confirmed downswing. Both indices are still in a weekly upswing. ⦿ Swing Confidence is 0. Long-only swing traders would be in all-cash now. ⦿ Auto, FMCG & IT indices are in confirmed upswing.
Breadth
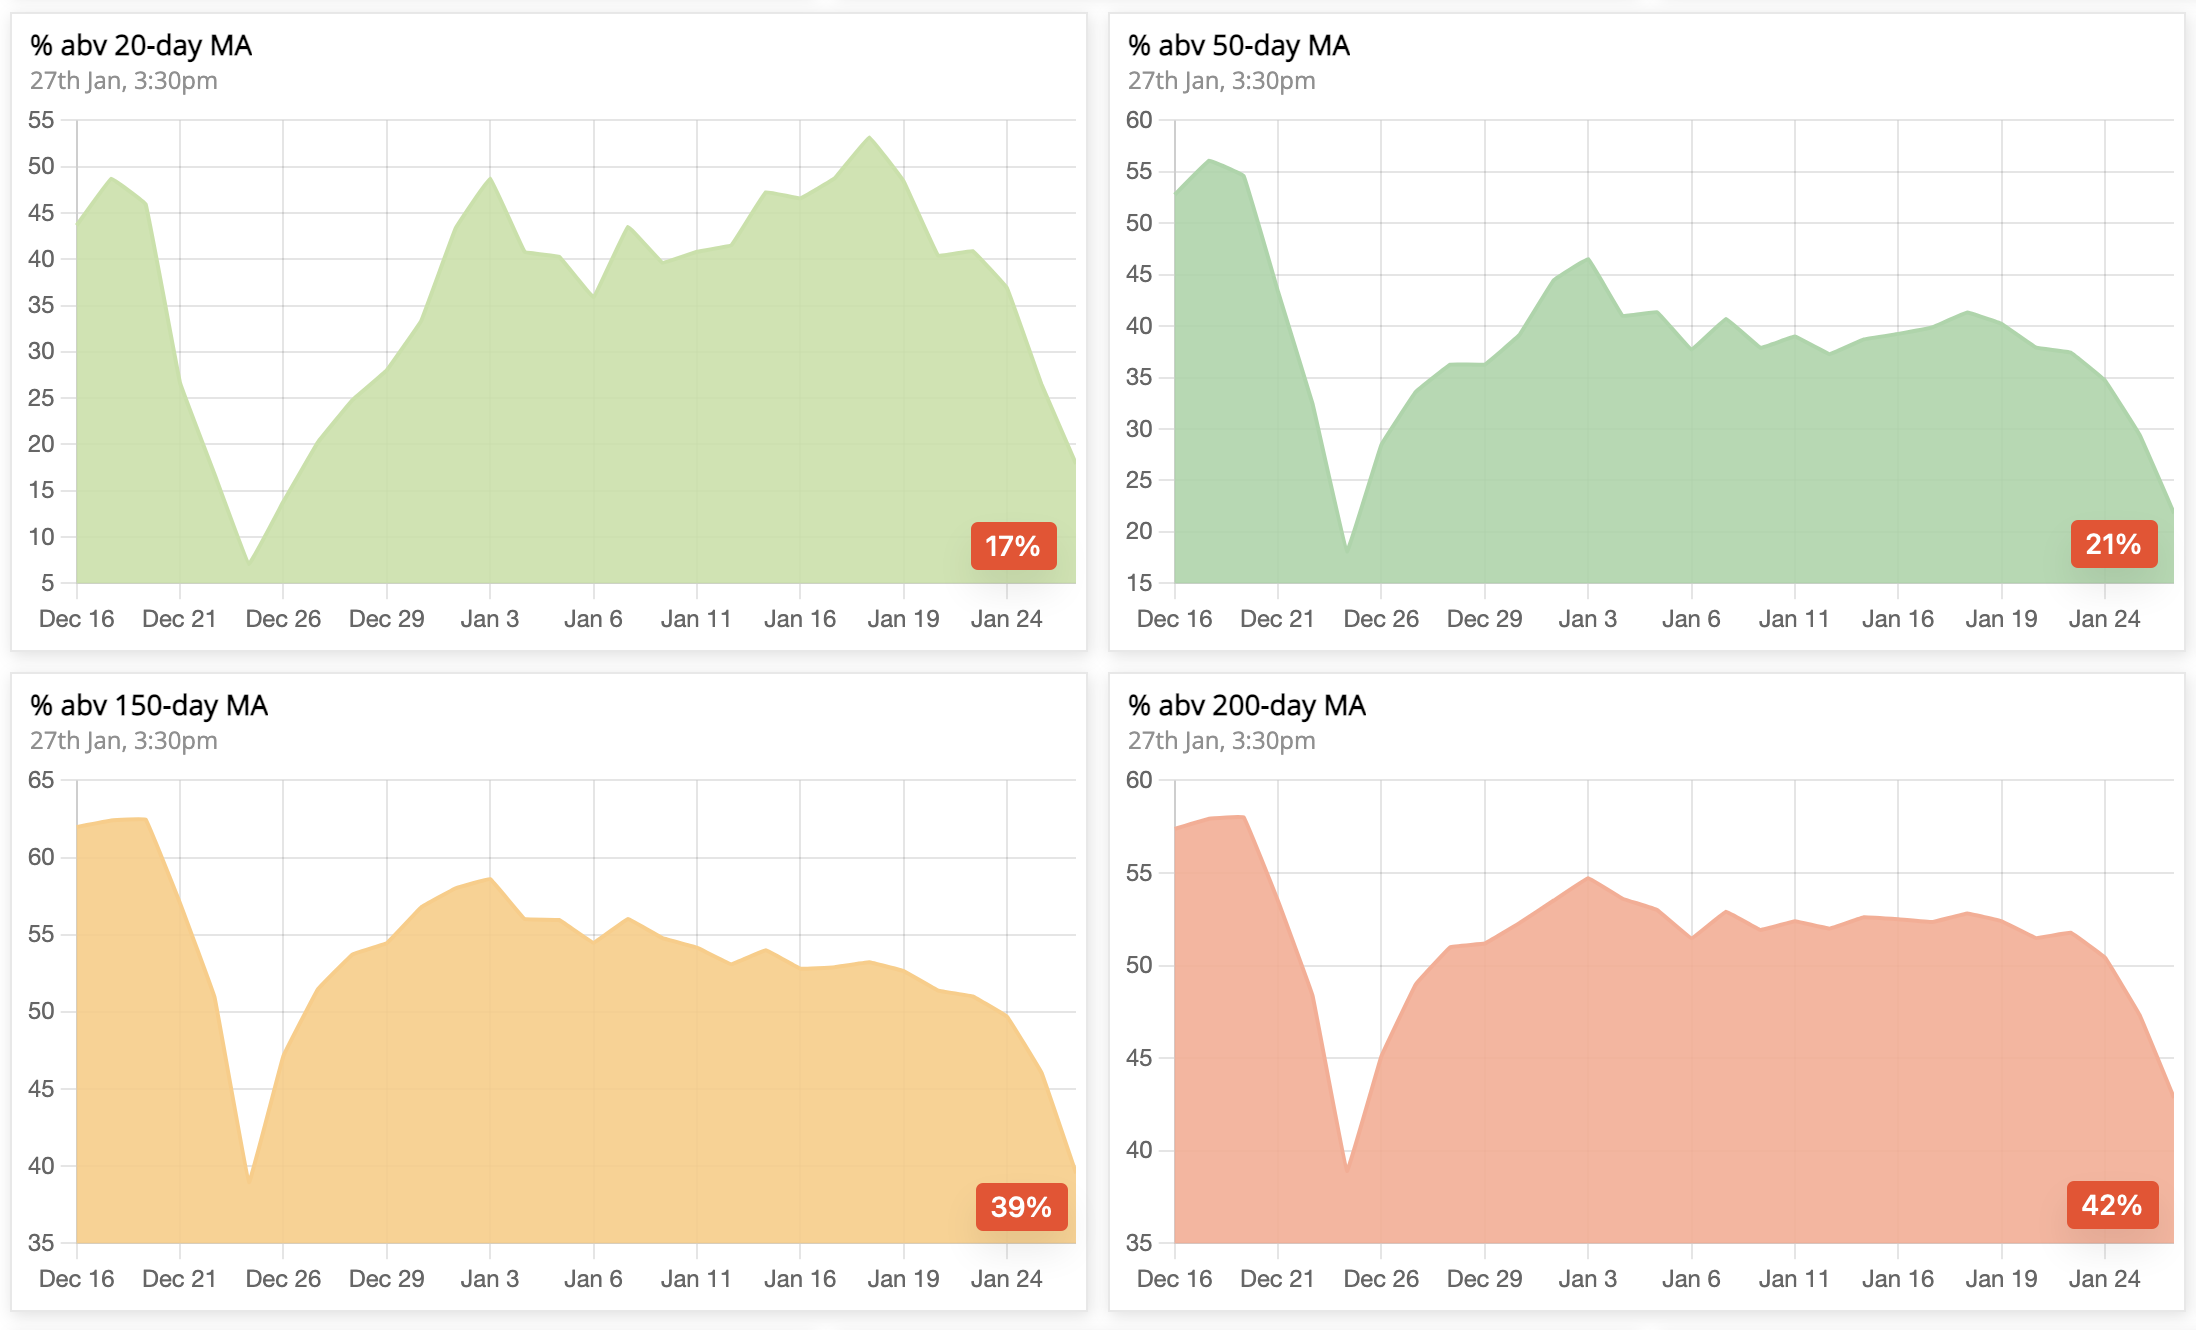
⦿ Market breadth is quite weak. ⦿ Lower timeframes are approaching oversold zone. ⦿ Higher timeframes are now bearish.
Bias
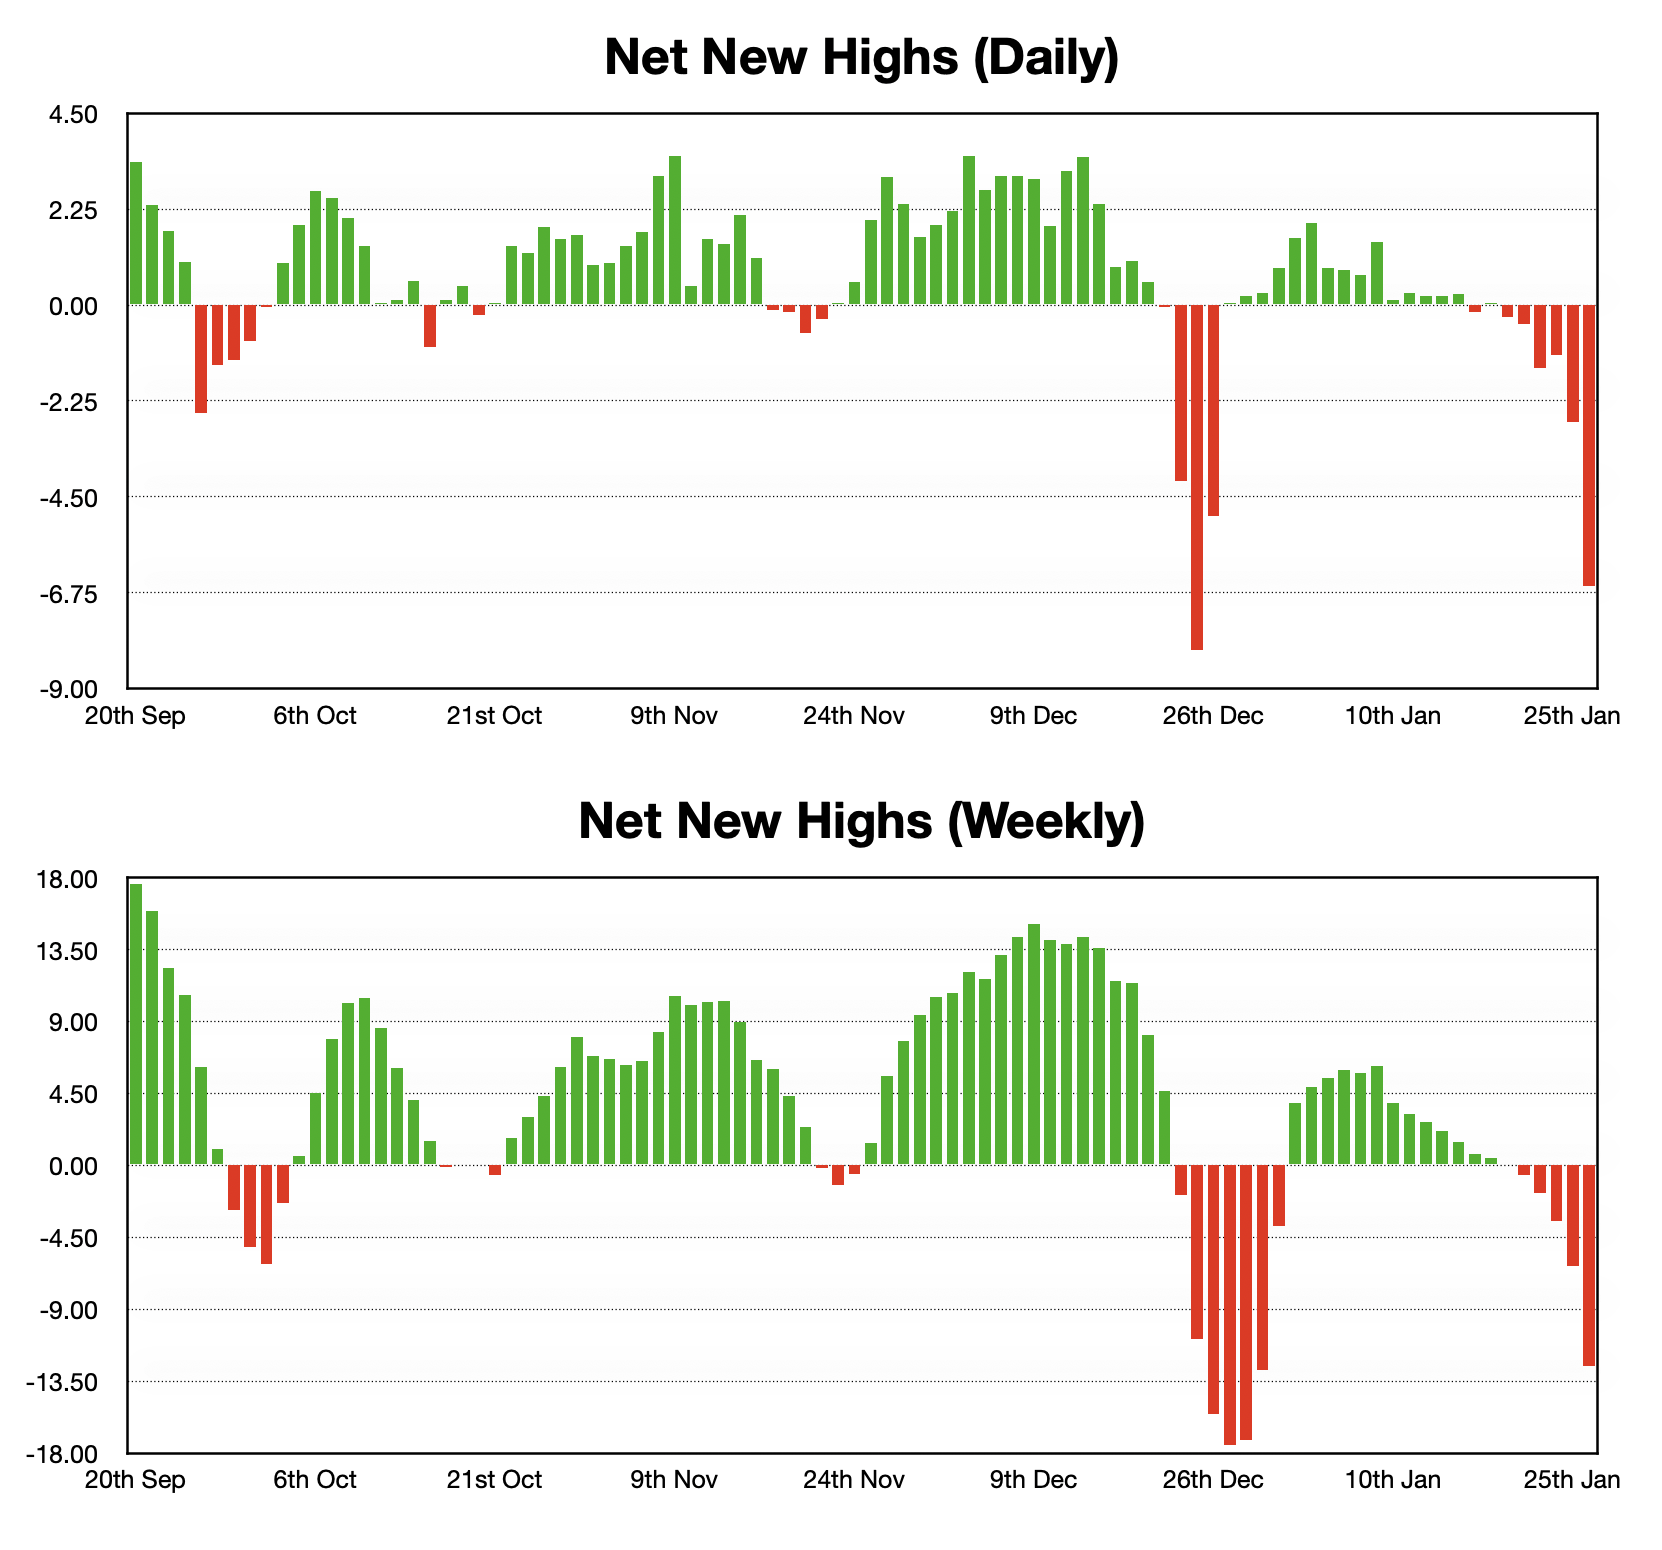
Difference between new 52-week highs & lows gives us Net New Highs.
⦿ Three consecutive positive days of net 52-week highs give us a positive bias towards the market, which is then considered favourable to trading. Conversely, 3 consecutive negative days of net 52-week highs give us a negative bias towards the market, which is then considered unfavourable to trading.
⦿ The daily bias should confirm with the latest weekly net highs.
⦿ If either of the above 2 conditions are not satisfied, the bias is termed as being sideways.
⦿ Currently, the bias is bearish. Last week’s sideways bias turned bearish this week on 23rd Jan.
MonthlyIndexCheck - Jan 2023
We began the month with a bullish bias but a negative momentum, that kept on worsening till the breadth & bias turned red. As the trend is still somehow braving the bearish assault, there still isn’t a sense of extreme panic. Will the trend survive, or will the bulls completely give it up from here?
That’s all for this week. If you'd like to know when I publish something new, just subscribe to my newsletter and you'll get the latest sent direct to you.
.png?disposition=attachment)