As experienced or novice PK/PD, PBPK, QSP modeler, focusing on the practical implications of using R² versus Adjusted R² for model evaluation and communication is important and often an overlooked exercise when modellers decide to use their hypothesis to explain the basis of data. I believe, a lot of the modelling activites from all the three disciplines converge to good understanding of how can you simply understand the complexity of biology- which is then exercised in different granularities in the 3 different arenas of using these techniques of modelling.
Today, I am going to cover how do we confidently assess if our complex/simple model truly reflects reality, or if it's just cleverly fitting the noise to satisfy our hypothetical build of the data (possibly also the reason why models attrition when taken from one phase to another)? A common metric we use is R-squared (R²), but in the world of multi-parameter PBPK/QSP or PK/PD (more parameter identifiability due to lesser parameters), relying solely on R² can be misleading. So, I believe that Adjusted R-squared (Adj. R²) is often the superior metric and using it impacts significantly the way we communicate our results.
Today, I am going to cover how do we confidently assess if our complex/simple model truly reflects reality, or if it's just cleverly fitting the noise to satisfy our hypothetical build of the data (possibly also the reason why models attrition when taken from one phase to another)? A common metric we use is R-squared (R²), but in the world of multi-parameter PBPK/QSP or PK/PD (more parameter identifiability due to lesser parameters), relying solely on R² can be misleading. So, I believe that Adjusted R-squared (Adj. R²) is often the superior metric and using it impacts significantly the way we communicate our results.
R²: the coefficient of determination. It tells us the proportion of the variance in the observed data (like plasma concentrations) that is predictable from our model. An R² of 0.85 means our model explains 85% of the variability in the observations. Sounds legit, right?
The Catch: R² has an inherent flaw when dealing with models containing many parameters, as PBPK/QSP models invariably do. Adding any parameter to a model, even one that is completely irrelevant, will almost always increase the R² value (or at best, keep it the same). It never goes down just by adding more complexity. This creates a significant risk of overfitting – building a model that fits the current dataset exceptionally well but fails miserably at predicting new data because it learned the noise, not the underlying physiological signal.
While PK/PD models are often less complex than PBPK models, even "simple" models (e.g., one- or two-compartment models with absorption) can suffer from misleading R² values.
Flaws of R² in PK/PD Models
Ignores Parameter-Poor Data Ratios
- Problem: PK/PD models often use sparse clinical data (e.g., 6–10 time points per subject). If a model estimates 4 parameters (e.g., Vd, Cl, ka, lag time), R² may overstate goodness-of-fit.
- Example: A one-compartment model (k=3) fit to 8 concentration-time points achieves
R²=0.92 Adding a lag-time parameter ( k=4) increases R² to 0.94, but Adj. R² drops to 0.89 due to the penalty for minimal data.
Fails to Penalize Overparameterization
- Problem: Even simple models can be overfit. For instance, adding a secondary absorption phase (
k=5k=5) to a one-compartment model may improve R² but not physiological plausibility. - Example:
- Model A: Cl, Vd, ka → R2=0.85, Adj. R² = 0.83
- Model B: Adds lag time (k=4) → R²=0.86, Adj. R² = 0.82
- Takeaway: The lag time marginally improves R² but reduces Adj. R², signaling overfitting.
Adj. R²: It modifies the R² value by penalizing it for every additional parameter included in the model relative to the number of data points.
 Formula: Adj. R² = 1 - [(1 - R²)(n - 1) / (n - k - 1)]
n = number of data points (e.g., observed concentrations)
k = number of model parameters being estimated or varied (e.g., Vmax, Km, tissue partition coefficients, rate constants)
The Key Difference: Adj. R² only increases if the newly added parameter improves the model fit more than would be expected by chance. If a parameter doesn't pull its weight in significantly improving the fit, the Adj. R² will decrease, signaling that the added complexity isn't justified.
Further, when we see negative values for Adjusted R for the following situations:
- overfitting
- small size of observed data vs number of parameters chosen for fit: When the sample size (n) is small relative to the number of predictors (k), the penalty term dominates. For instance, If n=11 and k=5, R² must exceed 50% for Adj. R²to stay positive
While R² can only be negative if the model is worse than a horizontal line. Adj. R² is designed to penalize complexity, making negative values a critical diagnostic tool for model quality
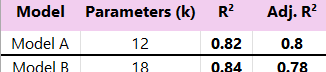
PBPK/QSP Modeling Example:
Imagine you're developing a PBPK model for a new oncology drug. You have sparse Phase 1 data.
- Model A (Base): Includes standard organs, systemic clearance parameterized via hepatic clearance (intrinsic clearance + blood flow). k = 12 estimated/sensitive parameters.
- Model B (Complex): Builds on Model A by adding specific gut wall metabolism, kidney transporter kinetics, and partitioning into adipose tissue. k = 18 estimated/sensitive parameters.
You fit both models to the observed plasma concentration data and get the following goodness-of-fit stats:
How Does Communication Differ?
Reporting Only R²:
Your message: "We developed two models. Model B provides a better fit to the observed data, with an R² of 0.84 compared to 0.82 for Model A. We recommend using Model B for future predictions."
The hidden risk: You've selected a more complex model based on a minor R² improvement. This model might be overfitted to the sparse Phase 1 data and could perform poorly when predicting Phase 2 results or simulating different populations (e.g., organ impairment). You communicate potentially false confidence.
Reporting Both R² and Adj. R²:
Your message: "We evaluated two PBPK models. While Model B showed a marginal increase in R² (0.84 vs 0.82), its Adjusted R² decreased significantly (0.78 vs 0.80 for Model A). This indicates that the additional complexity introduced in Model B (gut metabolism, transporters, adipose) is not sufficiently supported by the current data and may represent overfitting. Therefore, the more parsimonious Model A appears more robust and is recommended based on this analysis."
The benefit: This communication is transparent and data-driven. It acknowledges the slight R² improvement but uses Adj. R² to correctly flag the risk associated with the added complexity. It leads to a more scientifically sound model choice, builds credibility with colleagues and potentially regulators, and manages expectations about the model's predictive power.
AI assisted art coded in Processing, used Grok to improve the code- failed to improve it in OpenAI/Claude.