Issue 14. 2021-07-25
本来这期应该有很多奥运会相关的内容,而且说实话每项比赛都能有让人颇为惊艳的可视化展现方式。但恰逢开幕后的几天正在搬家,所以并不能及时跟进。下图来自于搬家途中所见。
- 欧洲城市战争模拟(当代版) - (reddit.com) 其实模拟起来就是把 nearest neighbor 两两比较,人口多的获得胜利并占有失败一方的人口,然后城市扩张。因为取近邻的时候有随性,所以导致每次模拟的结果都不太相同。有点「Risk」桌游的感觉。
- 科技巨头的并购历史 - Washington Post 文中用两种不同样式的 streamline 把 Apple, Amazon, Google, Facebook 四家科技巨头从诞生至今的主要收购历史做出了对比。其实有点像「冰山」的构造,你看到的主营业务/创始业务可能只是公司浮于水面上的部分,收购的业务涉及诸多领域,很多方面可能并不是那么耳熟能详。
- 一个基于文本的取色器 PhotoChrome. 使用的时候键入文本,然后网页会将 Unsplash 返回的搜索结果进行叠加,计算出平均 HEX 值,返回一个 palette.
- 自我创造机会和受助攻的三分球 - The F5 (substack.com) Owen Phillips 的 blog 我每周必看的一个原因是他的写作质量和 visualization 风格都相当稳定,犹如上班打卡。其实这个概念在英语中比较好区别,一个是 off-ball catch-and-shoot player 一个是 outside shot-creator. 当然,本文的谈论方面并非只有这一个话题,还包括了 r/nba 的消息源的一个 mosaic chart, 以及在最后的一个核心球员常规赛-季后赛使用-进攻效率比较。
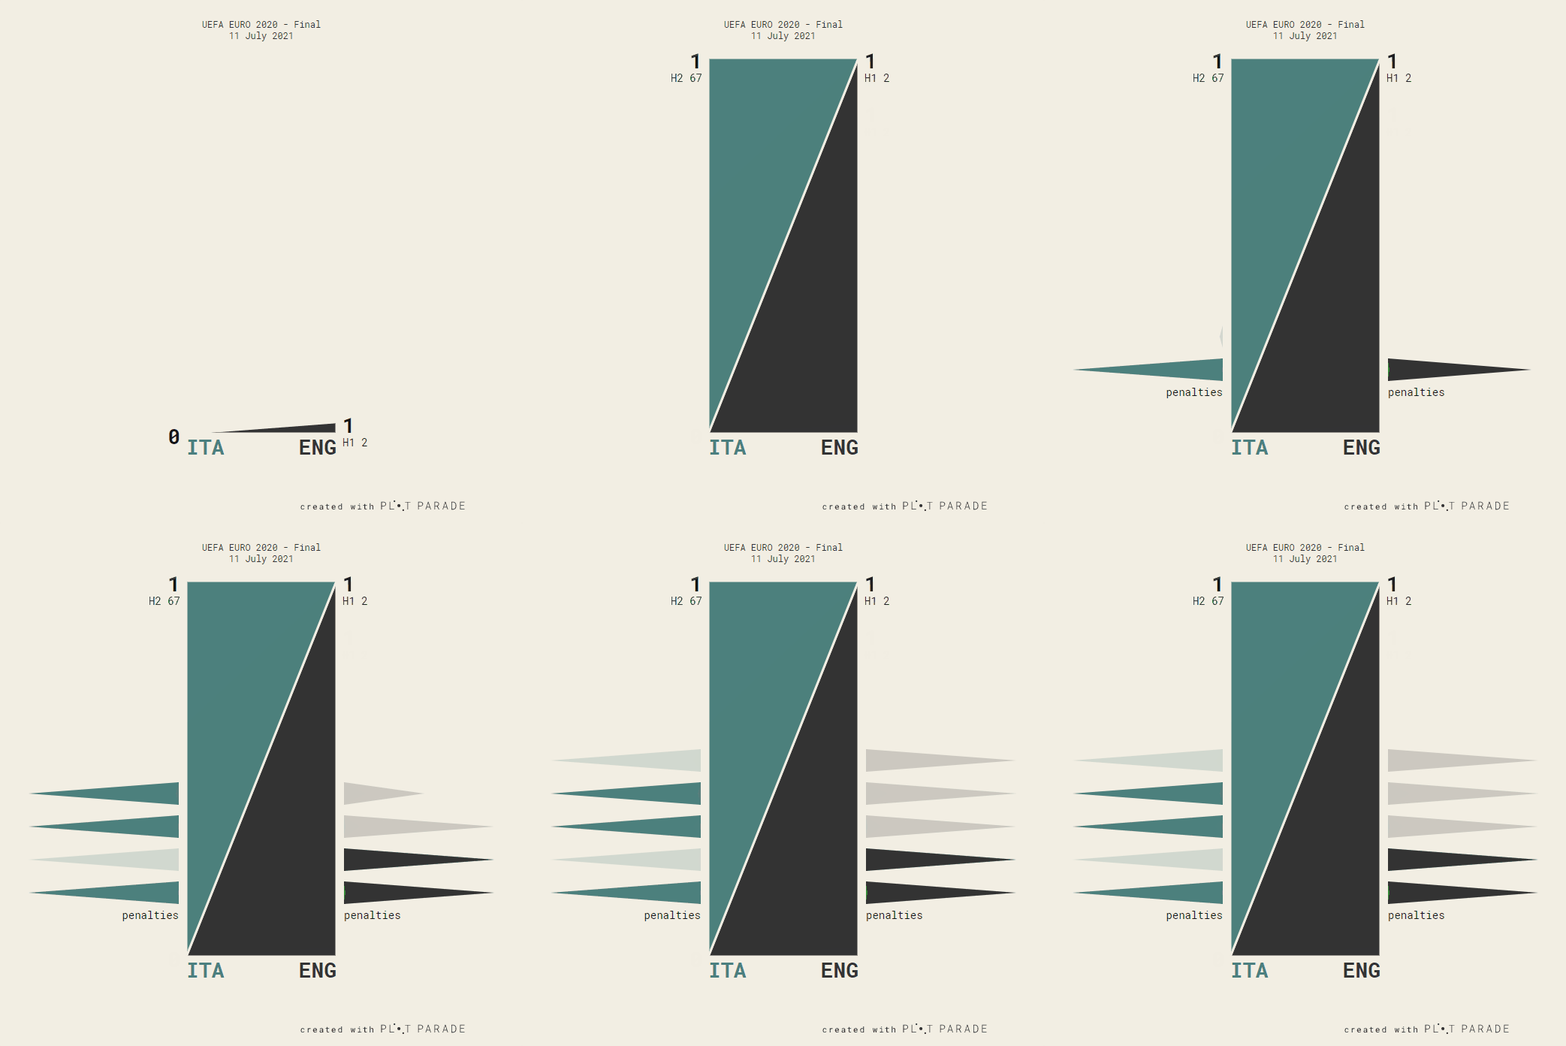
- 用多边形表达足球比赛的结果 - (plotparade.com) 上周介绍过的网站 Plot Parade 这次则更新了 EURO2020 期间淘汰赛阶段的几场比赛。用色克制也算是一大特色了(照理说会比较偏向用国家队代表色来做可视化)。

TL;DR The fans matter. A lot.
- 从 Apple Health 导出并分析自己的跑步数据 - inpredictable 导出数据是 XML 格式,随后就比较看个人的口味了。想起来原先从 Health 导出 Apple Watch 记录的 Activity 数据,现在 Health 所记录的数据种类更加多样化了。
- 截止今年三月的全球宜居城市排行 | The Economist 对疫情的控制肯定是其中一个重要的参考标准,现在澳洲就「挺不宜居的」。
- SQL 语句并不总从 SELECT 开始 - (jvns.ca) 有时候 SQL 引擎的优化也会改变运行顺序。
- 全球恢复指数 | The Economist 取了 50 个国家按人口比例计算了总体的一些活动量对比疫情前的数据,例如离家时间、通勤、航班、体育赛事上座率等。
- 如何给人简明扼要地解释 p-value| Towards Data Science 这就要涉及到我上月底做的一个面试题,用一分钟时间给普通人解释什么是 p-value. 我发现要解释的名词是环环相套的,不太容易在一分钟内做到。于是我找到了这篇文章,仔细研读了一下。
Obvious things, like facts. Non-obvious things, we want to prove or disprove it. We call the process Hypothesis testing. By convention, we call something is just like the status quo a null hypothesis, and alternatively, something makes a difference a alternative hypothesis. For example, null hypothesis is exercising does not affect weights. While alternative hypothesis is exercising affects weights.
How do we do the hypothesis testing exactly? We use data. We collect weight loss data for a sample of 10 people who exercise regularly in 3 months. The observed sample mean = 2kg, the observed sample standard deviation = 1kg.
Now assuming the null hypothesis is true, that no difference if we exercise or not, what is the probability of observing a sample mean of 2kg or more extreme than 2kg? If such probability is very low (say, <0.05), we reject the null hypothesis. Such probability is the p-value, just ==the probability of observing what we observed or extreme results if we assume the null to be true.== In statistics, it is also called the significance level.
FYI, we don’t say we accept the null hypothesis, we say fail to reject the null hypothesis. “We learned nothing interested.”
- Use the new R pipe built into R 4.1 | InfoWorld 比较新旧两种 pipe 符号在 R 4.1 之后的异同。
- Reservoirs are drying up in the Western U.S. - The Washington Post