I recently read a very interesting blog post about Wilks' Tolerance Intervals. Suppose we have a stream of numbers which are independently pulled from some distribution. We want to collect some number of these samples, and then estimate tolerance intervals for this distribution. The main idea in the blog post is that we can do this well with a surprisingly small amount of data.
To illustrate this, let's imagine a slightly simpler problem statement. Suppose we want to collect n samples, and we want to be 95% confident that at least 90% of the distribution has values no smaller than some estimated M. There are different ways of getting M and n. If n was very large, M would just be (well, very close to) the 10th percentile of the data in our sample. However, we want n to be as small as possible. We will just use the minimum of our sample as M. We can now focus on choosing sufficiently large n.
If we took n samples, and chose M as the minimum of those samples, what is the probability that at least 90% of the data is no smaller than M? This is our statistical confidence (call it p). We want this number to be 0.95. This is simply the probability that at least one sample falls in the bottom 10% of the distribution. Therefore, p = 1 - 0.9^n. Solving for n, we get n = ceiling of log(1 - p) / log(0.9) = log( 1 - 0.95) / log(0.9) = 28.43.
We now know that it takes only 29 samples to be 95% confident, that 90% of the data is no smaller than the smallest number in the sample. Notice that n depends much more on the percentage of data we want to cover than on the confidence value. For example, we could get 99.9% confidence and 90% coverage with only 66 samples. However, for 95% confidence and 99% coverage, we would need 299 samples.
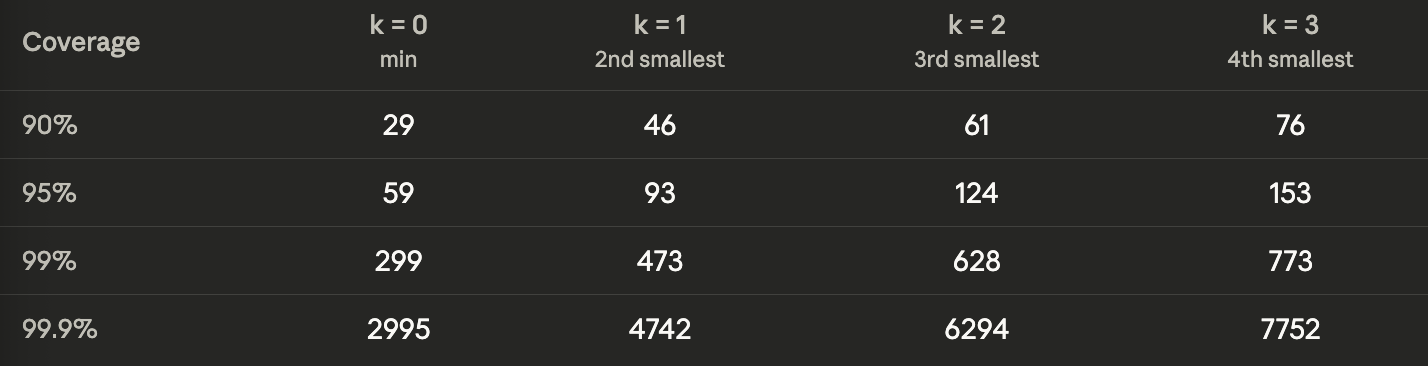
Is this the best we can do? That depends on how much data we have, and how large a sample size we are willing to accept. We can make our estimates more robust by deciding to take the k-th smallest number as M instead of the first one. The math here gets slightly more complex so we will not get into that in this post. However, you can see in the table below how the required number of samples changes as we discard a specific number of outliers. All values are calculated for 95% confidence.