Recently, I've started doing some software design docs for myself—the sad reality of a solo founder - writing docs with an audience of 1 - self.
Problem Statement
These have been relatively complex problems of passwordless authentication of humans and server storage data encryption (near 0-knowledge architecture). Stuff heavy enough that I wanted to visualise components and interactions between them just for my sanity.
I attacked the diagramming task as every self-respecting engineer attacks anything that needs to be done infrequently - by researching the lay of the land. Does MS Viso still look as scary as before? Is PlantUML still a thing? Is LucidChart not worth setting up another subscription for something you use infrequently? The answers to these questions were resounding, biassed yes!
Reduce. Reuse. Recycle
Not particularly happy with any of the choices, I decided to look further, to go back to first principles… I mean, charts are just shapes (icons, widgets) with arrows and text labels. Sure, various shapes and various types of arrows, but the general concept still holds. With these basic assumptions and newly found love towards Figma, I decided to see if one can use it for diagraming.
I had a difficult start with Figma. It just felt so bare. A few basic shapes + text... how am I supposed to create an interface mock or an interface with it. Over time, I learned to appreciate that the simplicity, composability, reusability and vast riches of community content allow one to create almost anything graphical (vector) using the tool.
In the end, by using Figma, I could avoid getting yet another SaaS subscription and work on learning (relearning?) a new tool only to forget it N weeks from now. As a bonus, it allowed me to hone my skills in the software I also use for basic UI design.
Reduce, Reuse, Recycle and functional minimalism. Just like using mail for blogging...
Figma for diagramming - the cookbook
This section covers how to graph like a pro using Figma. I tried to make it so minimal Figma experience is needed, but it might've been a failure. I'll use an example of diagramming a GCP Datastore document structure. It's a more complex example, as there needs to be a well-established practice of how to diagram NoSQL entities. Also, it's a more difficult problem than a component diagram (requiring just boxes+arrows). Finally, it was my exact problem, allowing me to use real-world use as a reference.
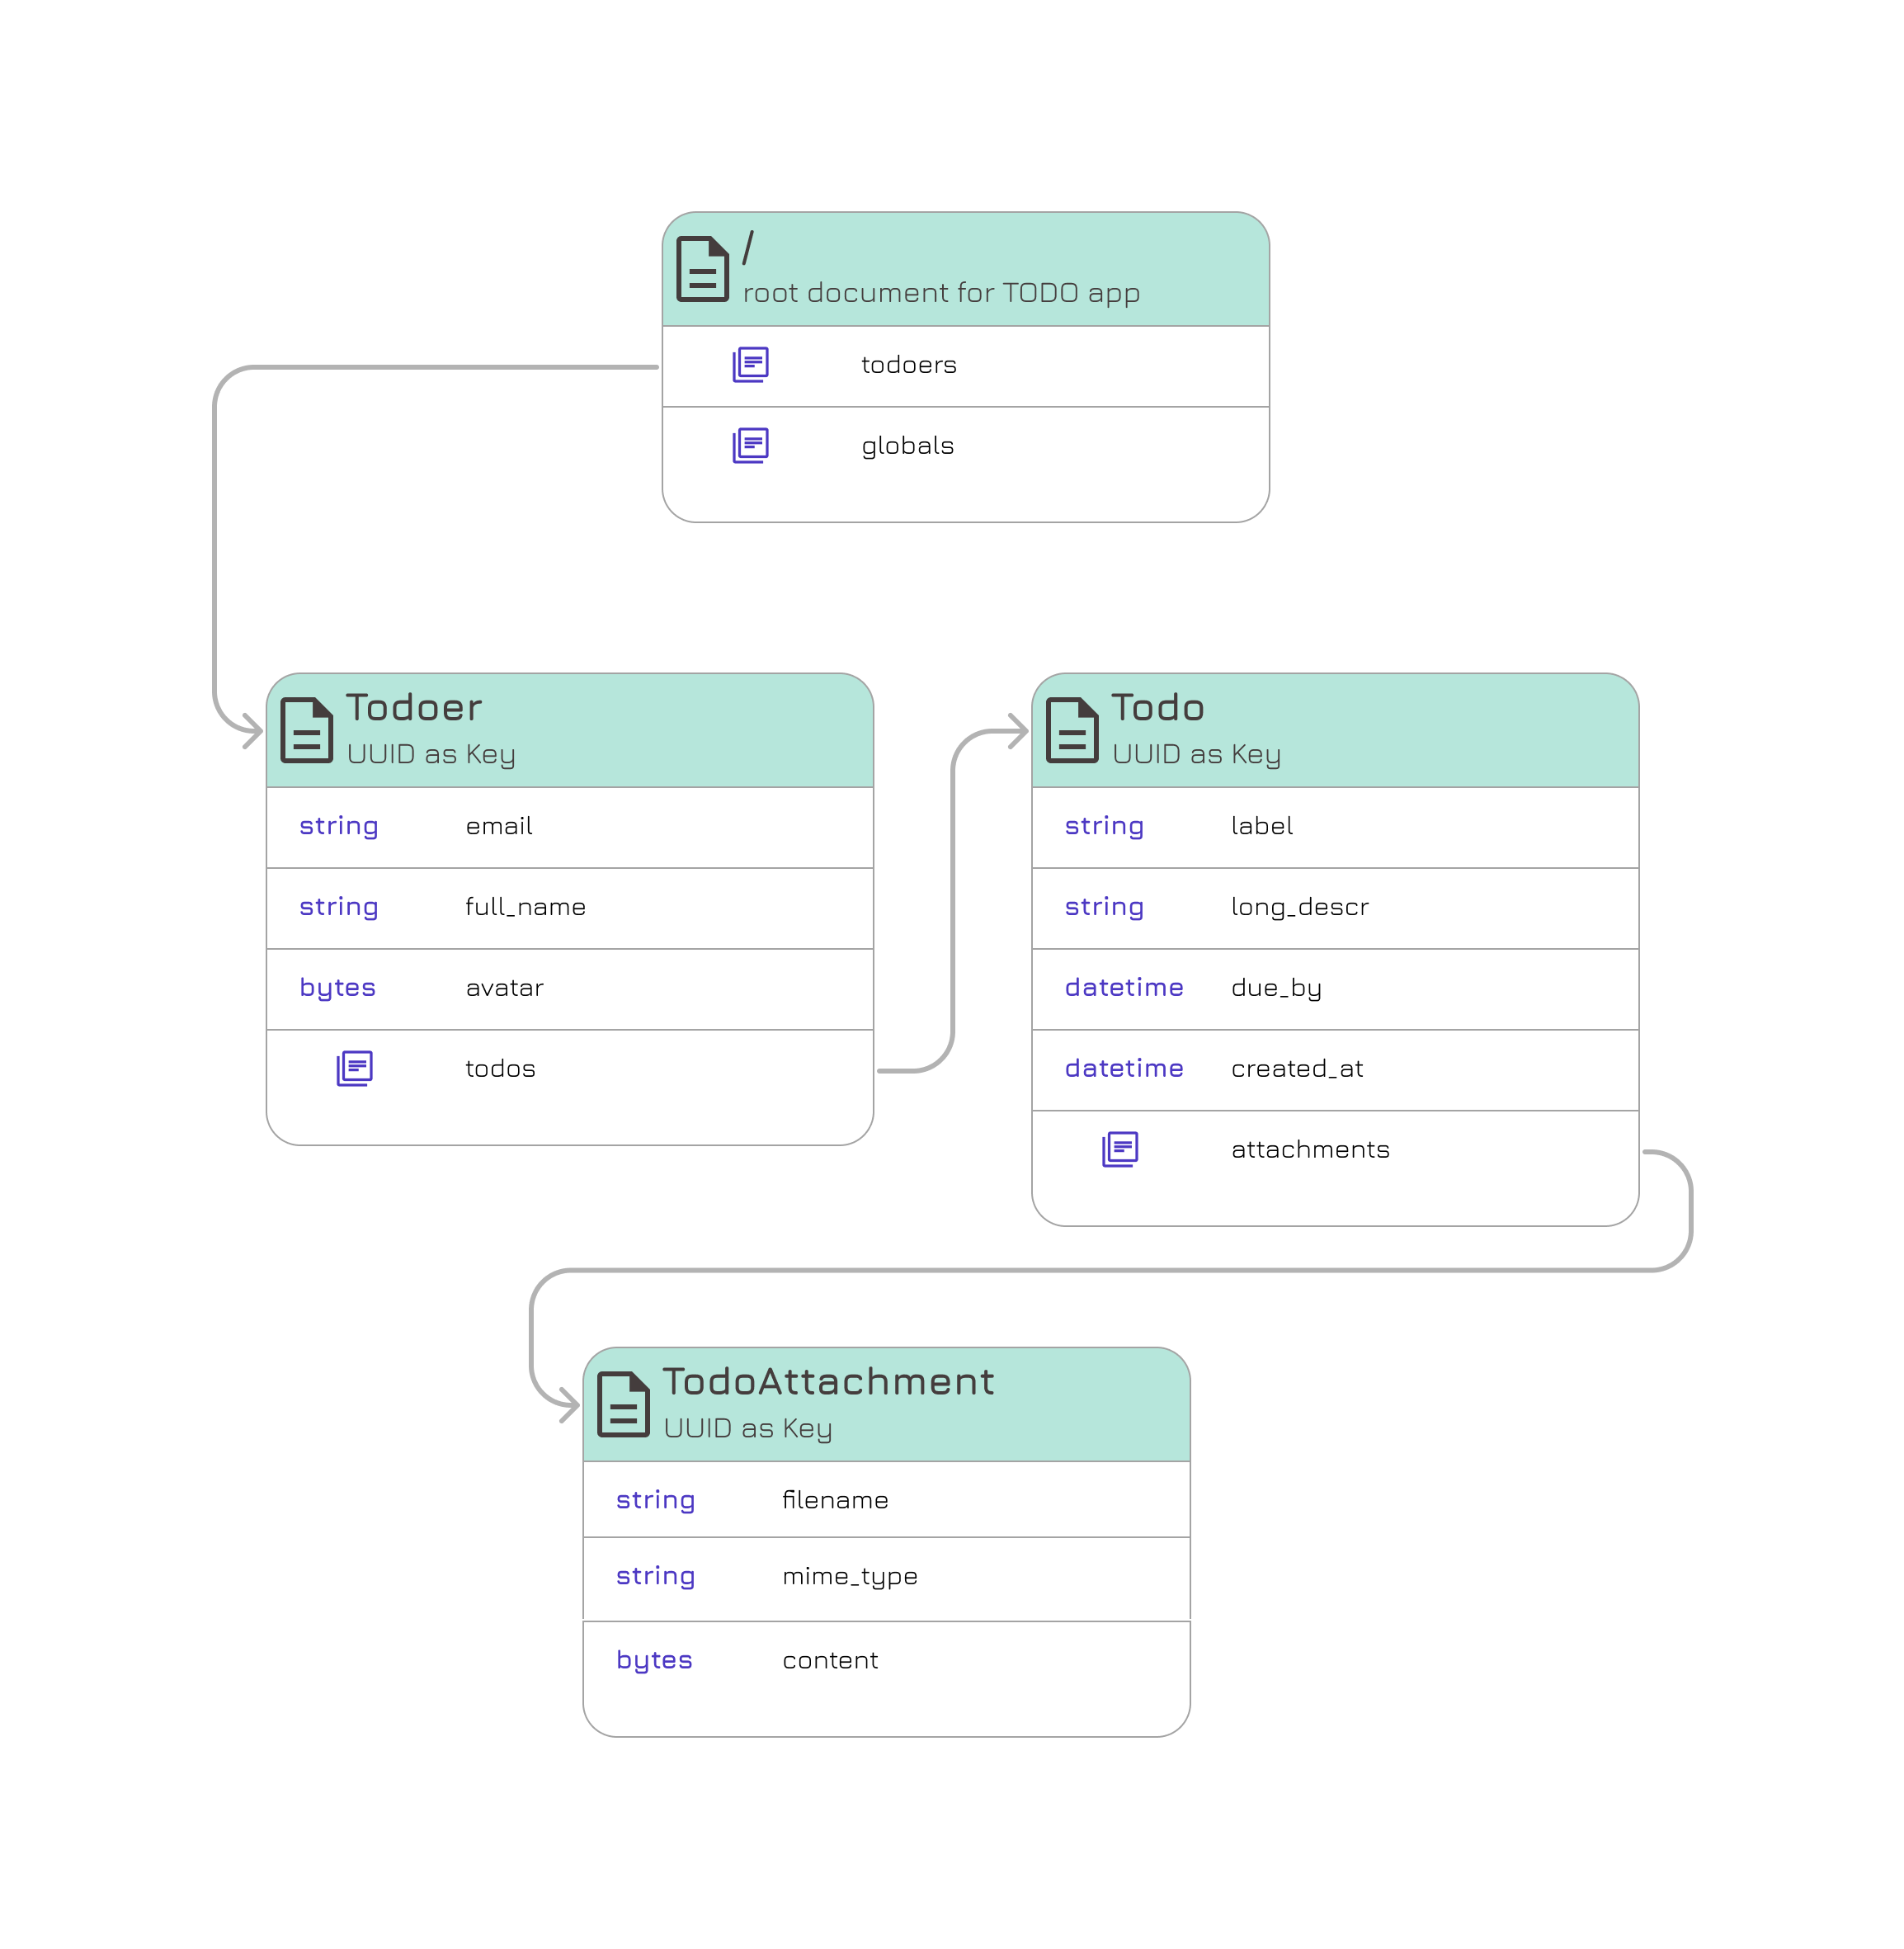
Today, we'll be cooking the following diagram:
A simple and lightweight document storage data model for a basic TODO app.
Method - Document table component: Go to the store and pick up a ready-made component from the freezer here. Publish the DocuElement element as per the last step below.
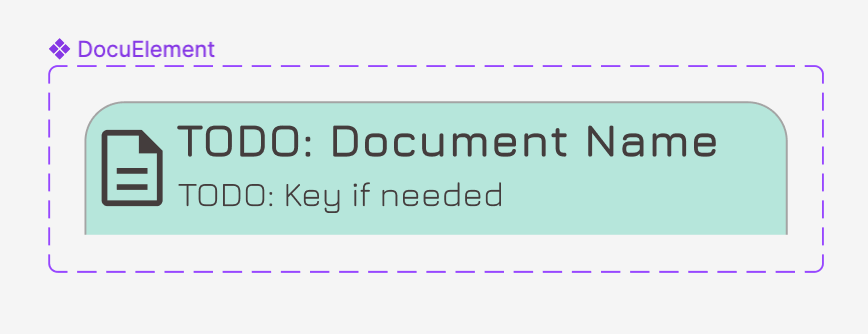
-- or -- 1. Create a new Design file. We'll be using it to create the necessary components next. 2. In the design file, "draw" the template for the header of your document entities. Just a rectangle with some background colour, a placeholder for a document's human-friendly name and keying details. Slap some corner radii and maybe a material icon for some flair.
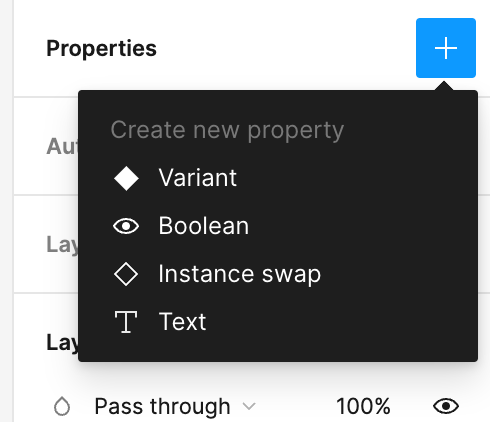
3. Now, turn your drawing into a proper component. Select all the items that make the header, and frame them (right click -> Frame selection), then turn the frame into a component (right click -> Create component). Maybe add a meaningful name. 4. Add a variant property to the newly created component - select the DocuElement, then in the Design pane on the right, click "+" next to the Properties section, and select Variant as the property type. Name it as, say, "Type".
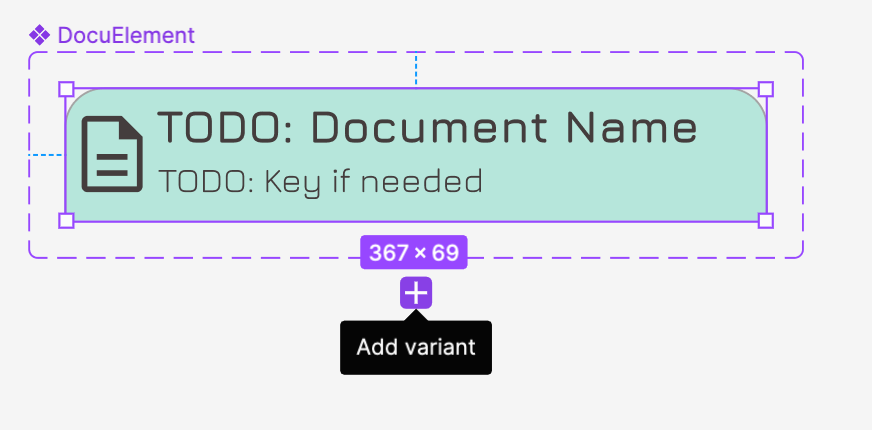
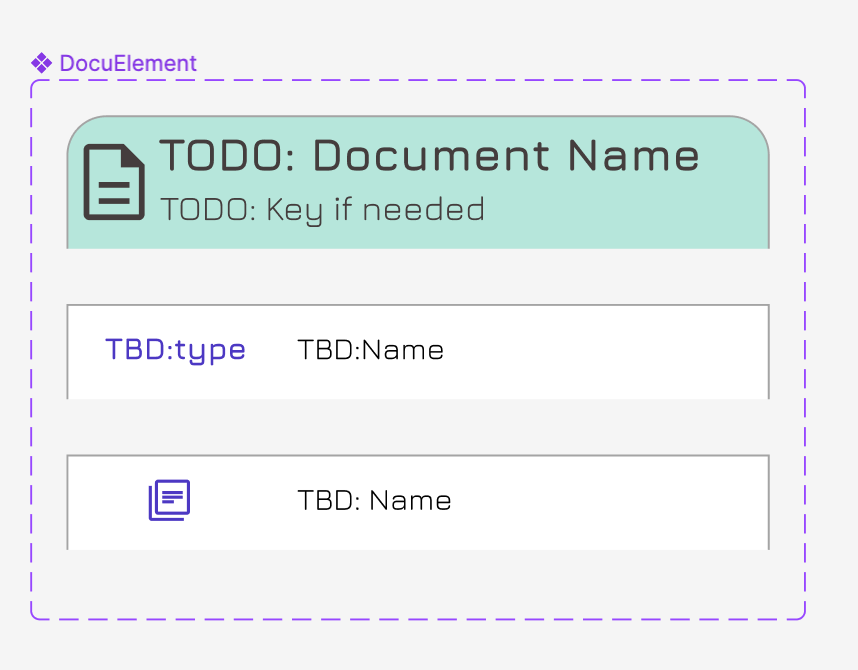
5. Figma will create this pretty, purplish, dashed, corner-radiied frame around your component. That border is your component area, a place for all the variants. Your magic header is inside that area as a component with Type=Default. Feel free to rename it to Type=Header.
6. Let's create a component for the document data property. Select the Header variant of the element you've made to reveal the magic plus button.
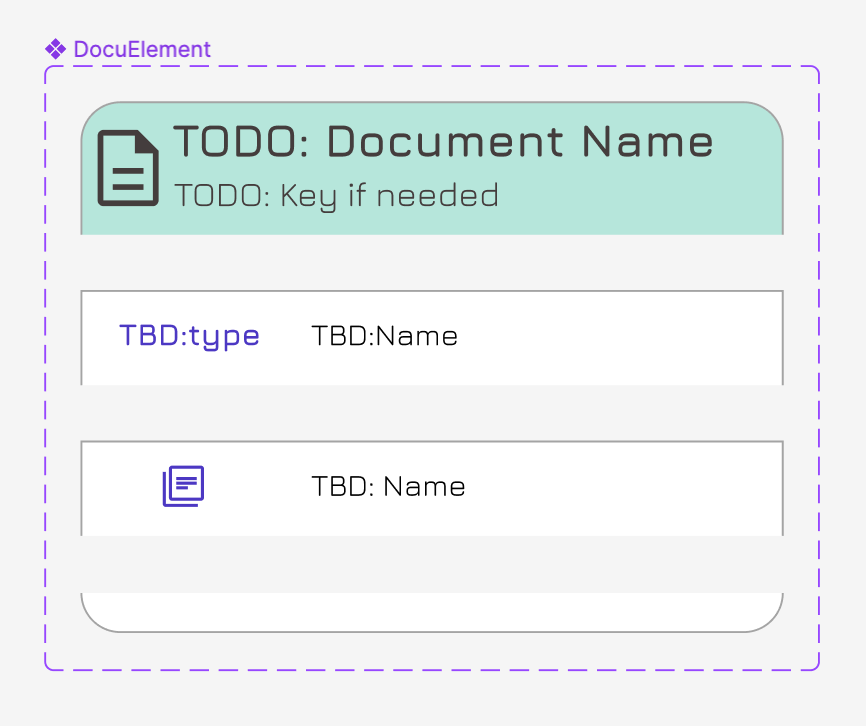
7. Clicking it will create a new variant of the component as a clone of the header. Adjust it and rename it to something more meaningful, like Property. While you're at it, you might as well create another variant, off of the Property, for a collection. You will end up with something like this:
8. To complete our charting magic, let's add a footer. It will allow us to close the document table with style.
9. With the component complete, we can publish it - on the left pane, select the Assets tab, and click the book icon to open the library. Follow through the process to publish the component. Learn more on how to publish components from this article: https://help.figma.com/hc/en-us/articles/360025508373-Publish-styles-and-components.
Method - create a diagram: With the prep work complete, we can finally get to some cooking and plating.
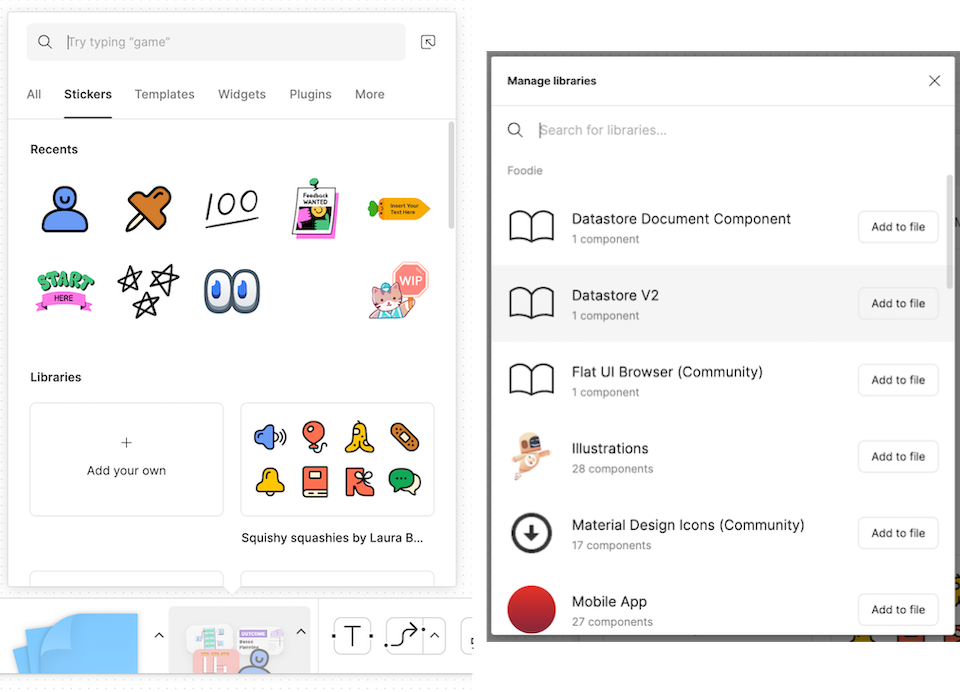
1. Create a new FigJam file for the diagram 2. Add the component created above as a sticker. Open the stickers menu, click "Add your own", then select your design file and click "Add to file":
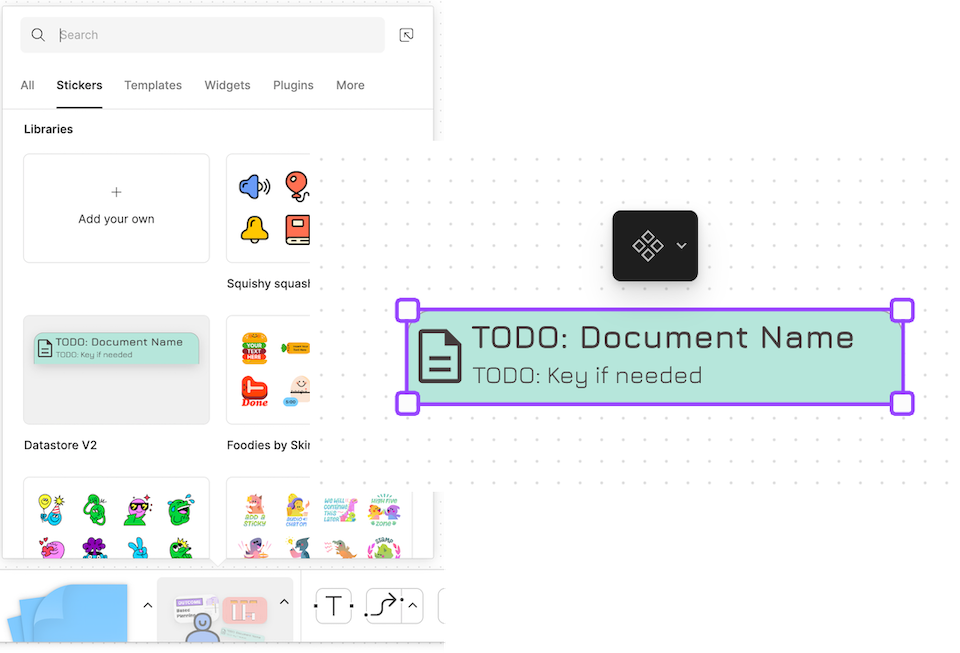
3. With the DocuElement included as a sticker, we can finally get to some charting! Drag and drop the sticker anywhere onto the FigJam
4. Finally, we can go crazy with the diagramming! Rename the entity, and add a key if needed. Copy and paste to duplicate. Use that four rhombuses button to change the entity type to either property collection or a footer to finish the entity table. Add arrows to make it wholesome!
Sorry if you're reading this on your phone. It seems that hey.com does not present animated GIFs there
Et Voila, our diagram is ready!
Parting words Based on the steps above, it probably feels like using Figma for diagramming is convoluted and not worth it. What I love about this approach the most is its flexibility. Since Figma allows one to draw anything, one can create any components for any diagram, even diagram types not imagined before. Furthermore, thanks to its vast library of Community content, one may find existing diagramming widgets to skip the costly process of creating your own.
In any case, Dear World, I hope you have found this guide valuable. If you have, please let me know via email, LinkedIn or even Mastodon.