Product roles are frequently solo roles. There's a lot of collaboration with designers and engineers, but it's uncommon that two product people work alongside one another. That's why you hear a lot about being the "CEO of the product" or owning things, whether a product, feature, flow, or metric.
The list of reasons I wanted to join 37signals back in 2022 was long, but collaboration was at the top. I've read a lot of product job descriptions, but none of them described it like this.
In many ways, it's a creative writing partner role — like a screenwriter often has a writing partner. Many of the best scripts ever written were written by two minds with one pen. You'll bring your original ideas, the CEO will bring his, and together, you'll riff and refine them into the ones we choose to design, build, and deliver.
What does that look like in practice, though? We recently shipped two Basecamp features that are great examples.
The spark for these features was the struggle of staying on top of a bunch of projects at once. Basecamp has the Lineup that shows how projects fit on a timeline, and Hill Charts, where you can track to-dos along a hill for a single project, but there's not a central place you can check on Monday morning to see how all of your projects are going and which ones need attention.
I don't run projects day-to-day, but I'm responsible for making sure the teams are successful. Not being able to see where everything stands at a glance was increasingly a pain point I felt personally.
Customers have brought this up many times over the years, so we had interviews and notes that captured the problem well. I started exploring and sketching different ways to solve it.
The first time we discussed it, Jason asked good questions that helped refine the problem. We also talked through how data alone is rarely sufficient to understand the true state of a project. What does 82% of to-dos completed mean? Is the remaining work easy or a big pile of unknowns?
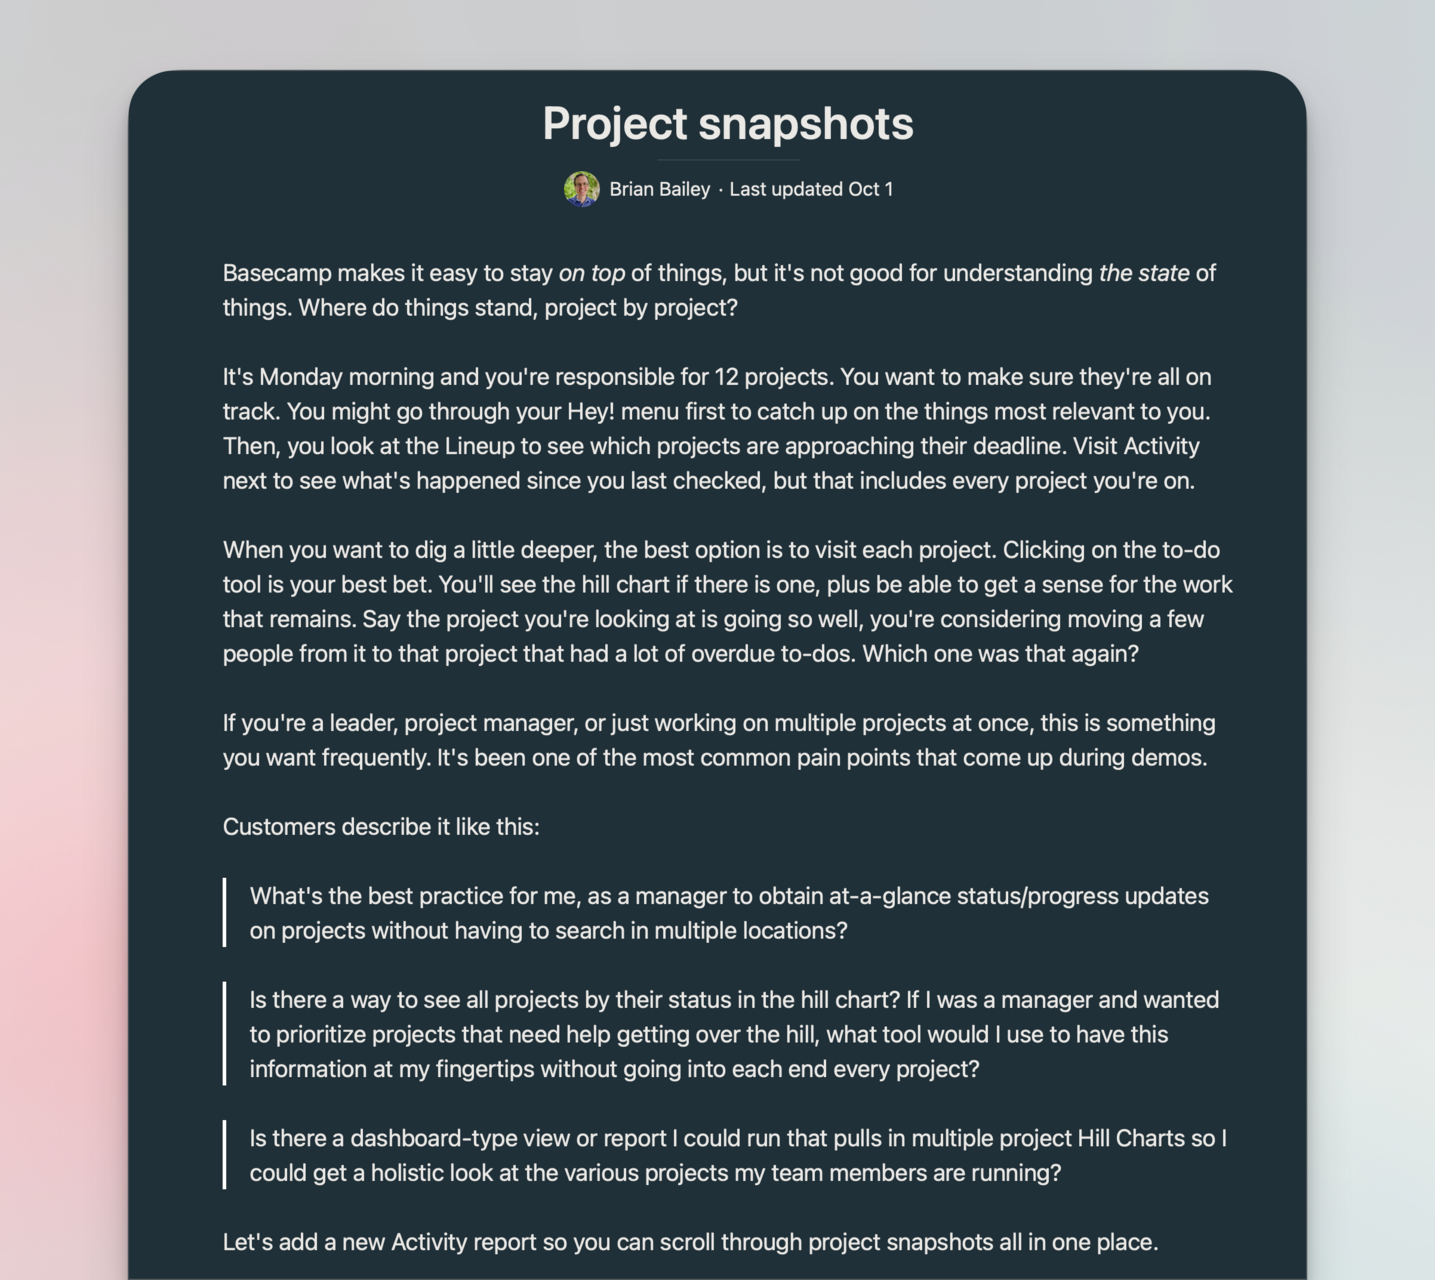
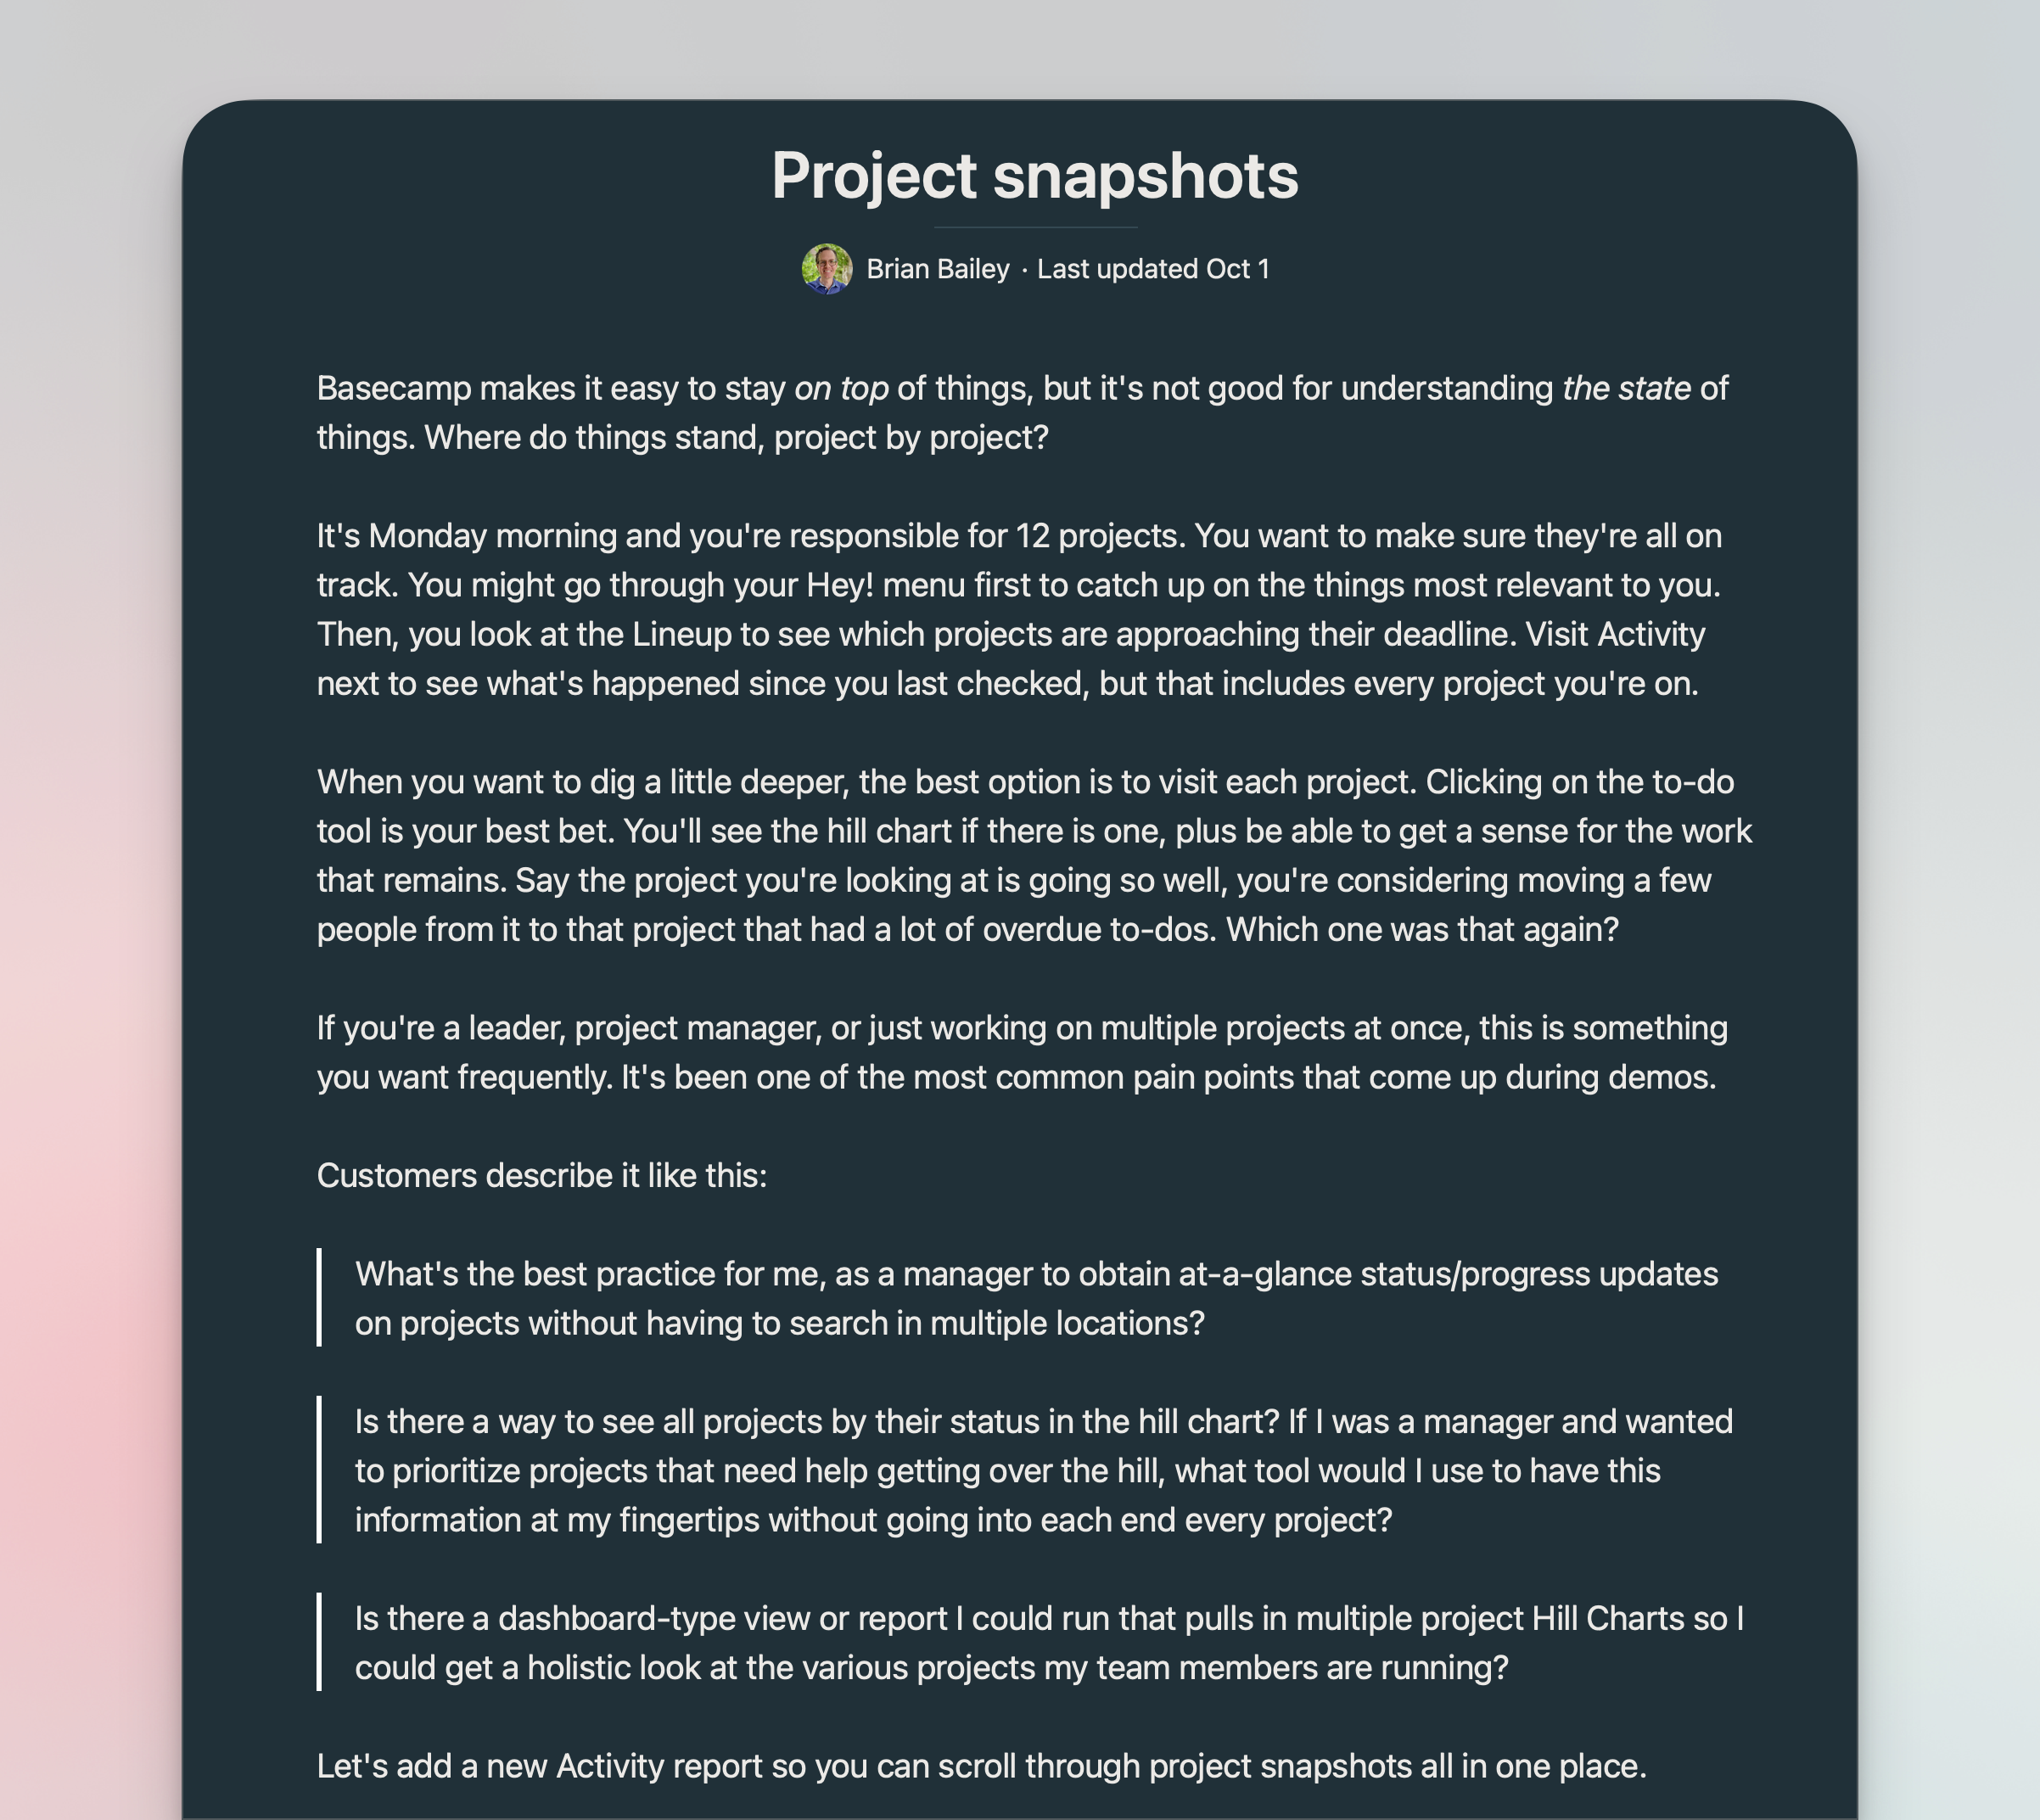
After more thinking and conversations, I landed on a solution I was happy with and turned it into a pitch. I called the feature Project Snapshots.
This idea leaned heavily on Hill Charts as the way to visualize a project's progress. Now, you could go to a single page and scroll through your projects, each summarized in a large card.
The card would show the current Hill Chart, basics about the project, and key pieces of data, like the number of overdue to-do's and cards, what coming up this week, and more. From the pitch:
The snapshots are meant to capture the state of the project as succinctly as possible. These are signals — they're not going to answer every question, but they'll help you know whether a project needs your attention or is humming along.
The snapshots would also capture activity. Has this project been active lately? What about compared to normal? Unusually quiet or buzzing projects are both worth a second look.
Snapshots didn't require Hill Charts, but they were better together. Plus, perhaps one would encourage the use of the other.
I knew the pitch cut against the grain a bit. It relied on data more than we typically do, even if it avoided things like a progress bar based on completed to-do's. But looking at things differently is one benefit of not being here for many years. The most important thing was that it captured the problem and one way to solve it. That was enough for the Betting Table.
The Betting Table
The next Betting Table was in-person in Barcelona during our meet-up. We talked through the pitches one-by-one, with Jason and David asking questions and digging into the problems and solutions. When we got to Project Snapshots, the problem resonated, but they were skeptical about the solution.
First, it relied on Hill Charts, which only capture the work in to-dos and don't fit every project. Second, it wasn't obvious that the data would tell a clear story, especially when you're catching up on multiple projects at once.
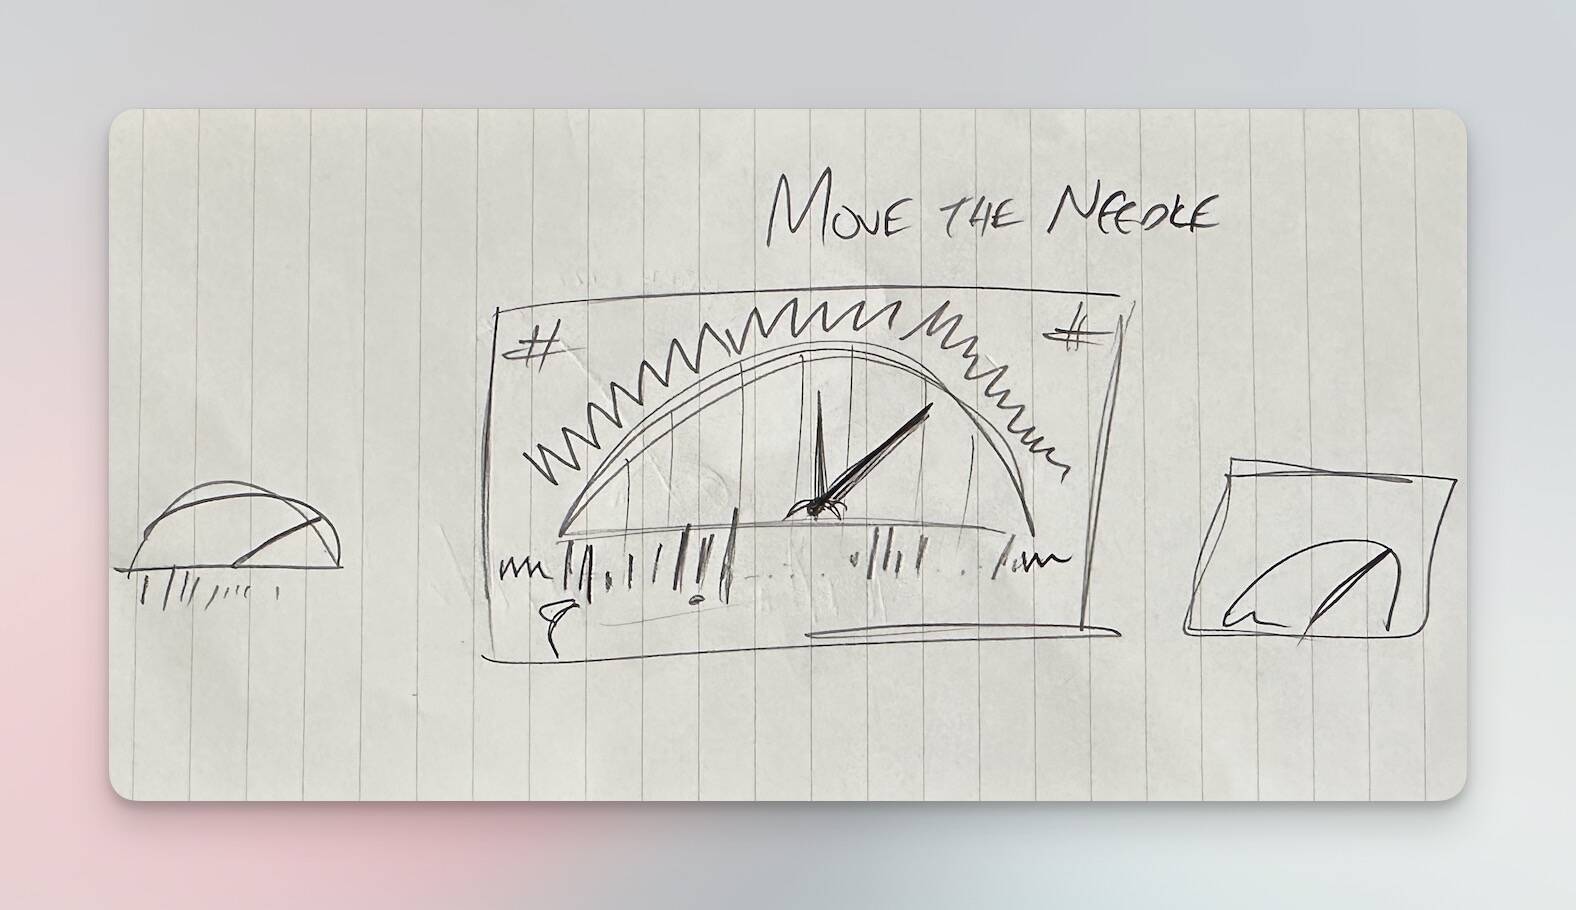
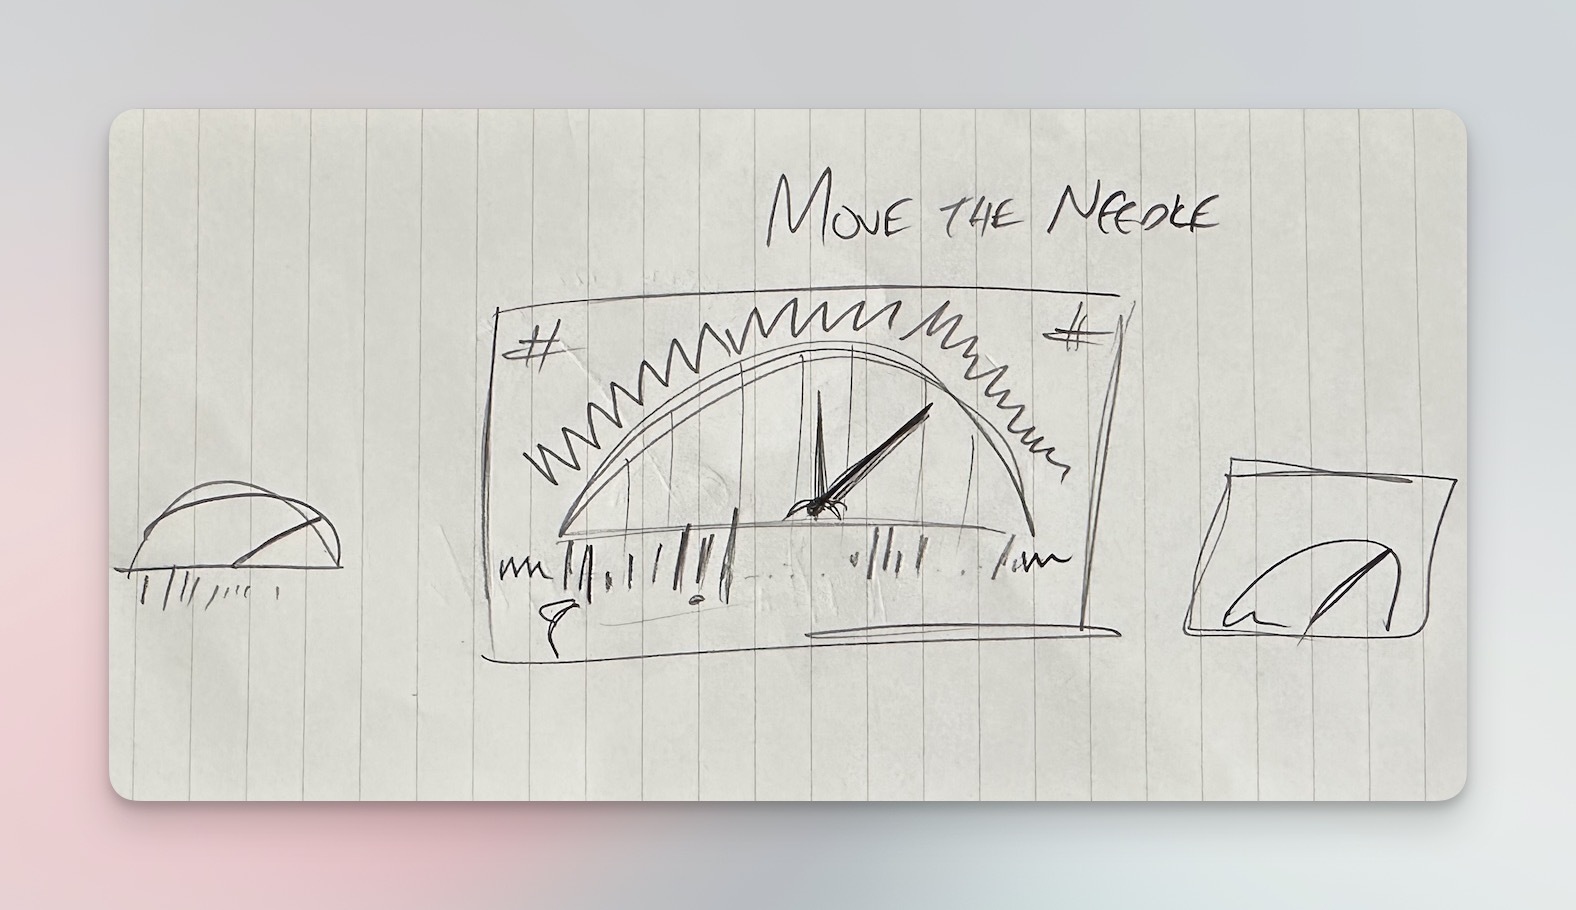
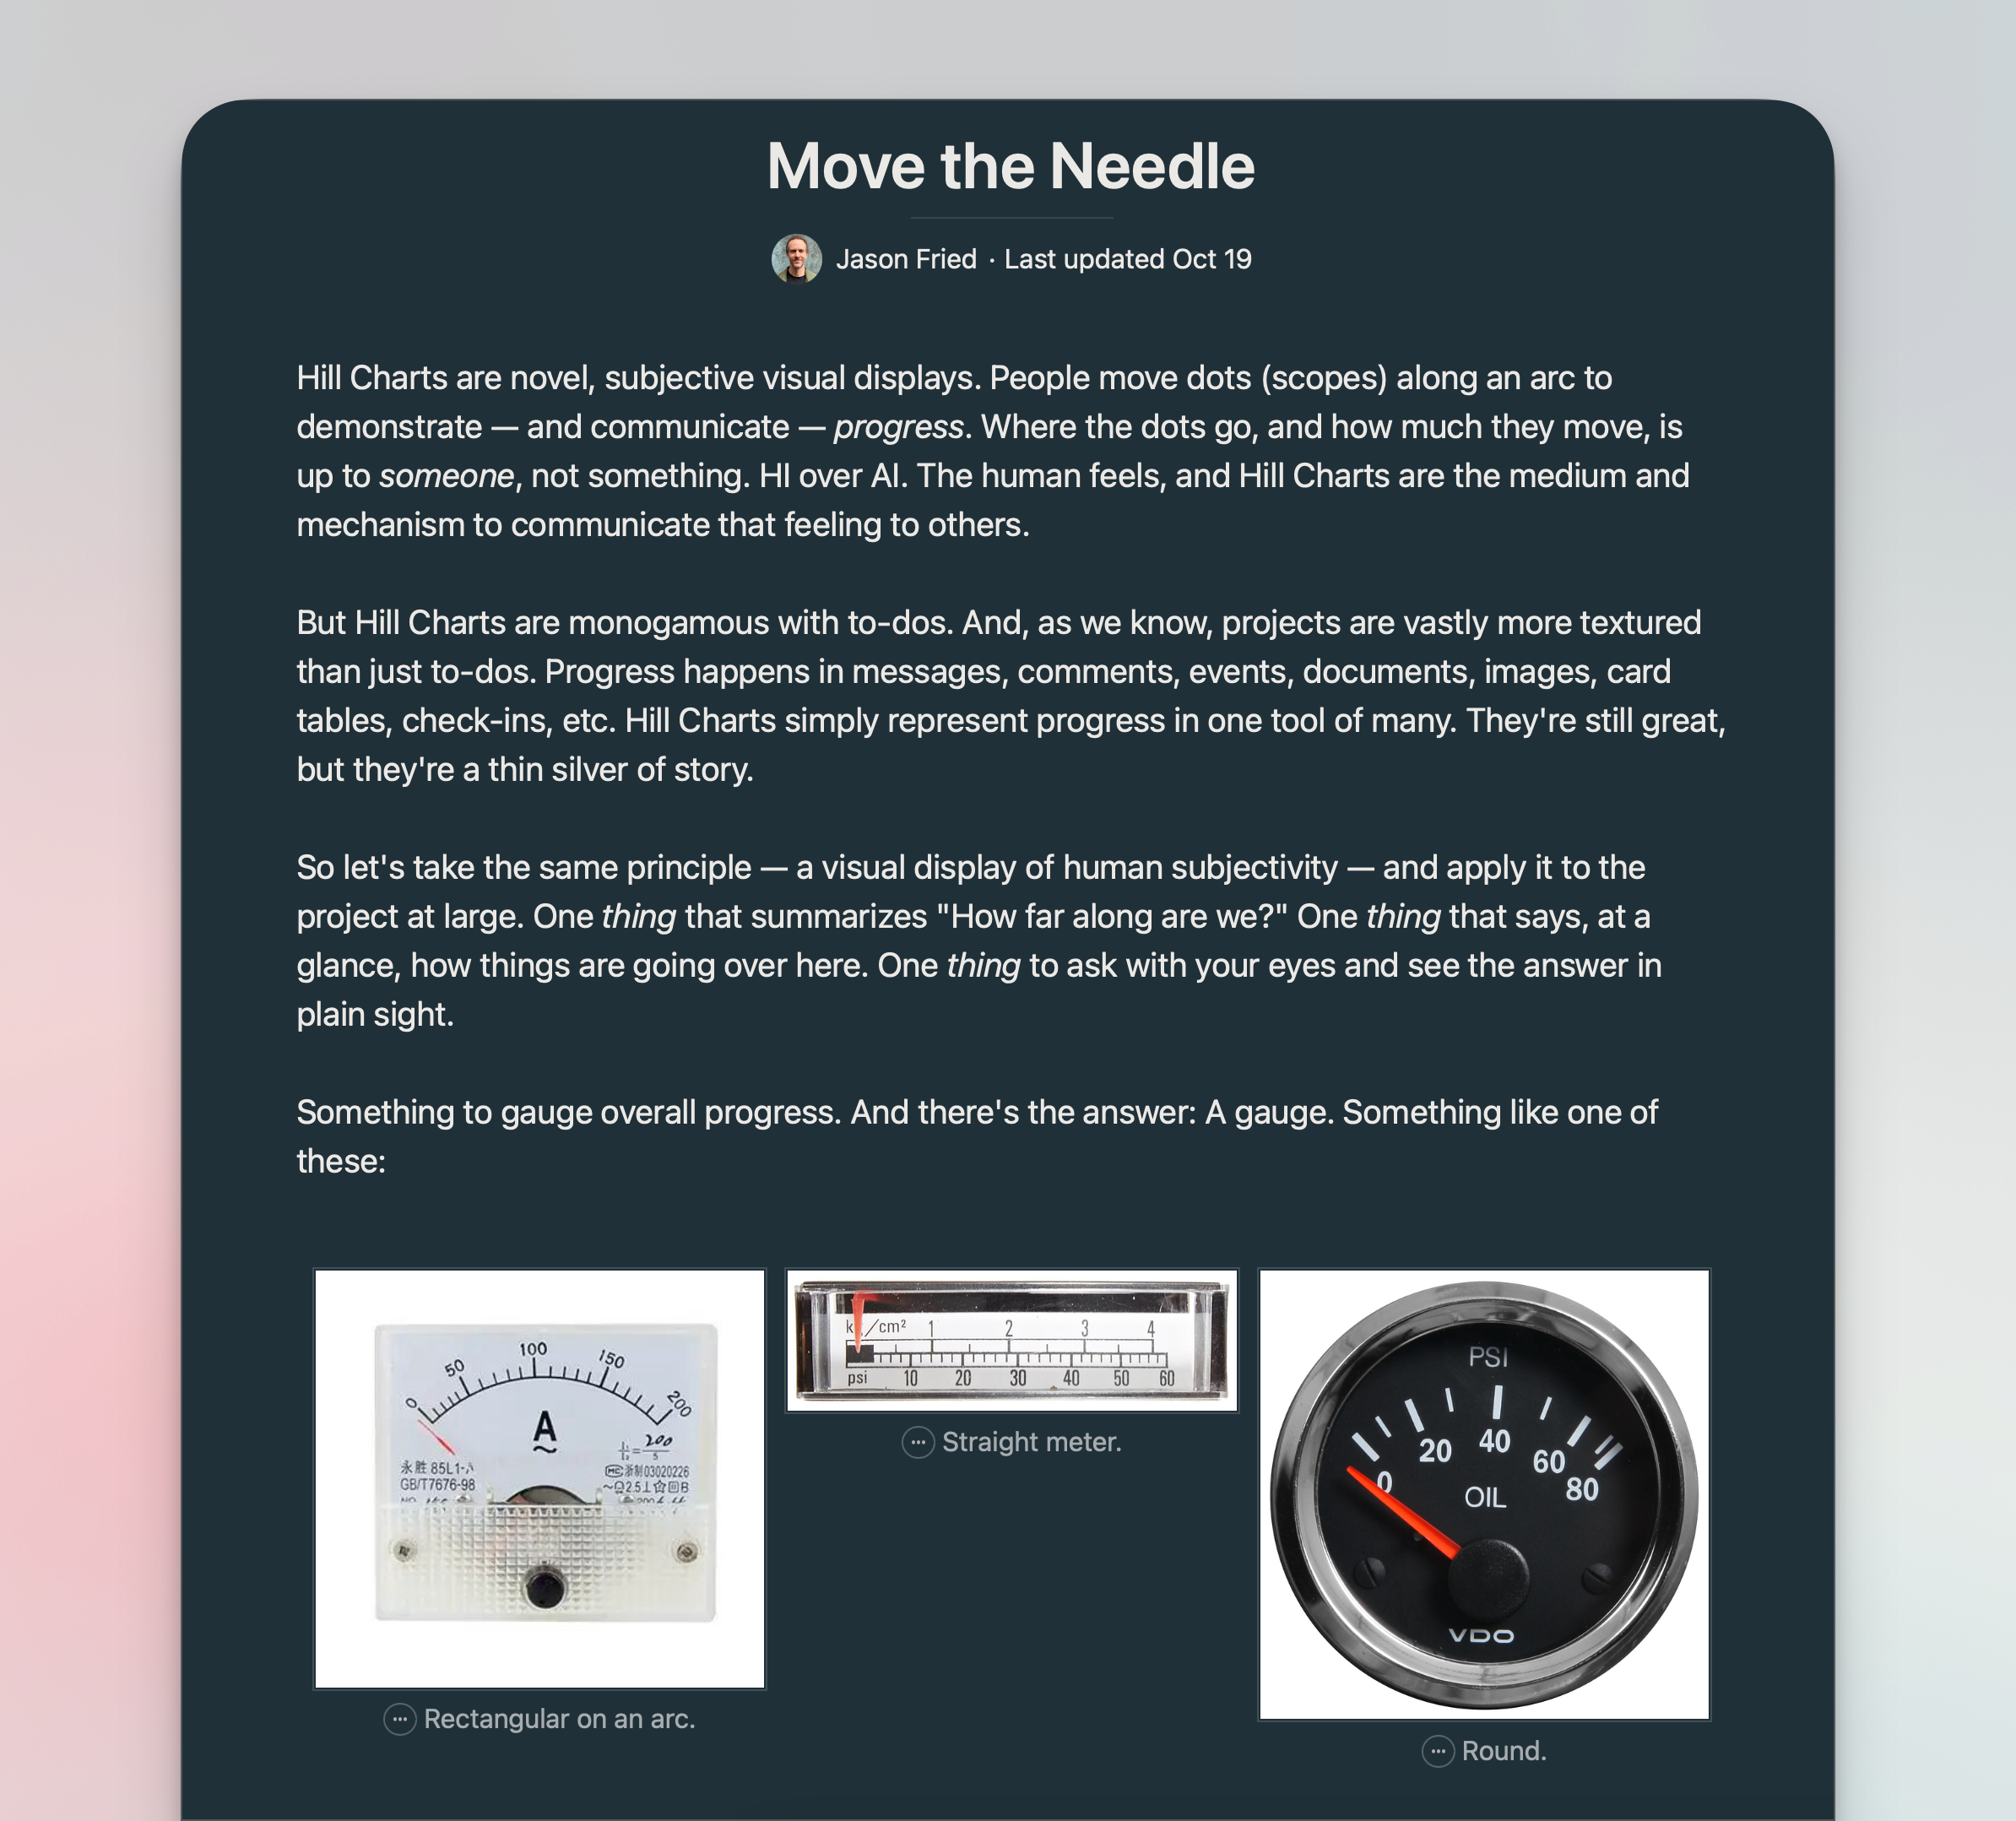
You know what would tell you a lot at a glance? A single gauge with a needle. Move the needle to right as you make progress.
Jason came up with it and things started falling into place. When you want to check in on a project, you don't ask "How many incomplete or overdue to-do's are there?" You ask, "How's the redesign going? How far along are we?" The people working directly on the project answering those questions tell you more than data can. The subjective take is counterintuitively more telling, and the needle makes it easy to communicate the answer visually.
We started riffing on the different ways it could work, then he grabbed some paper and sketched it out. About 20 minutes later, we had it.
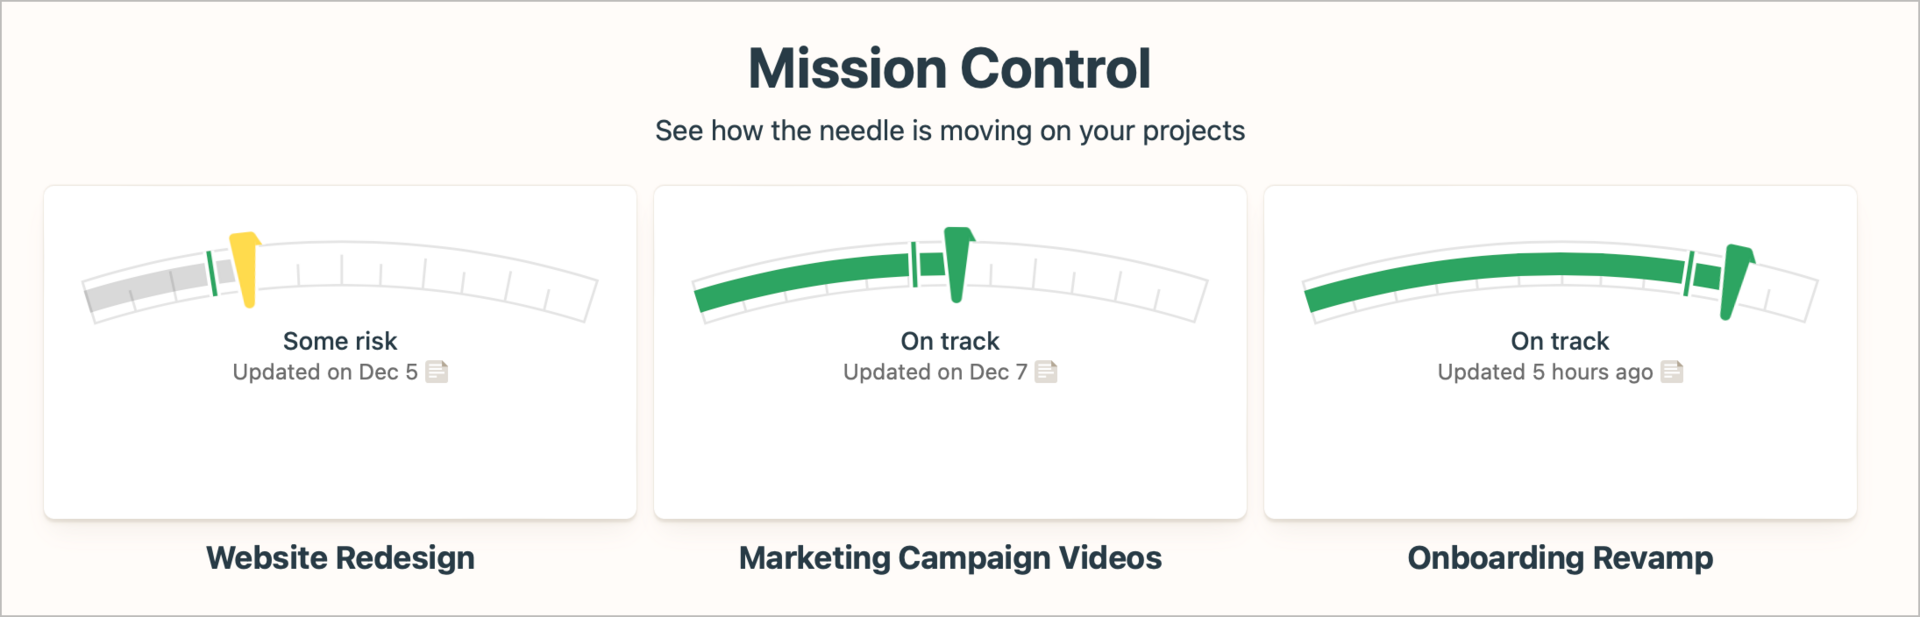
The language tied things together perfectly. Making progress? Move the Needle to show it. Want to see all the needles at once? Go to Mission Control.
I wouldn't have landed on the needle on my own. I had doubled-down on Hill Charts rather than introduce a different way to show progress. Jason wasn't constrained by what we had.
But Jason wouldn't have shaped this himself either. The spark for him came from seeing the case laid out and an option on the table.
After we got back, he turned the ideas into a pitch.
Building
Move the Needle and Mission Control were enormously fun to build. The team did a fabulous job getting the essentials built quickly so we could try it out, refine, improve, experiment with different wording, and try it some more. It's amazing what they built and the care they put into it.
During the 6-week cycle, we did a handful of design reviews and recorded two of them if you're curious to see behind the scenes (first and second).
We were close to shipping when Jason made the call to turn it on for our account first. You can iterate all you like, but using something on actual projects tells you much more. We made a number of changes that improved what we released.
A perfect example is finished projects. As work wrapped up, we realized that a needle that's all the way to the right (Woohoo, done!) didn't look much different from a needle at 90%. Also, Mission Control was going to quickly fill up with finished projects that haven't been archived. We added a done state and moved completed projects to a new section that gets tidied up automatically.
Closing the loop
There was one missing piece, though. The needle showed progress, but a project can be 80% done and at risk. You also can't compare one needle to another. Yes, this project is farther along, but maybe the other project just started or has a longer timeline. A page full of needles alone doesn't show you where you might need to lend a hand.
That was a key part of what I was trying to solve with Project Snapshots. The metrics may not have been the right solution, but I couldn't shake the feeling that the needle was only solving one part of the problem.
Then I remembered the mid-cycle updates I had written for Jason and David in the past. I would list the projects, write a few sentences about where they stood, and color code them. Projects that were green were on track, yellow meant there was some risk, and red was for those that were in jeopardy of not shipping. They could scroll through the doc, enjoy the sea of green, then dig into any that weren't. Simple.
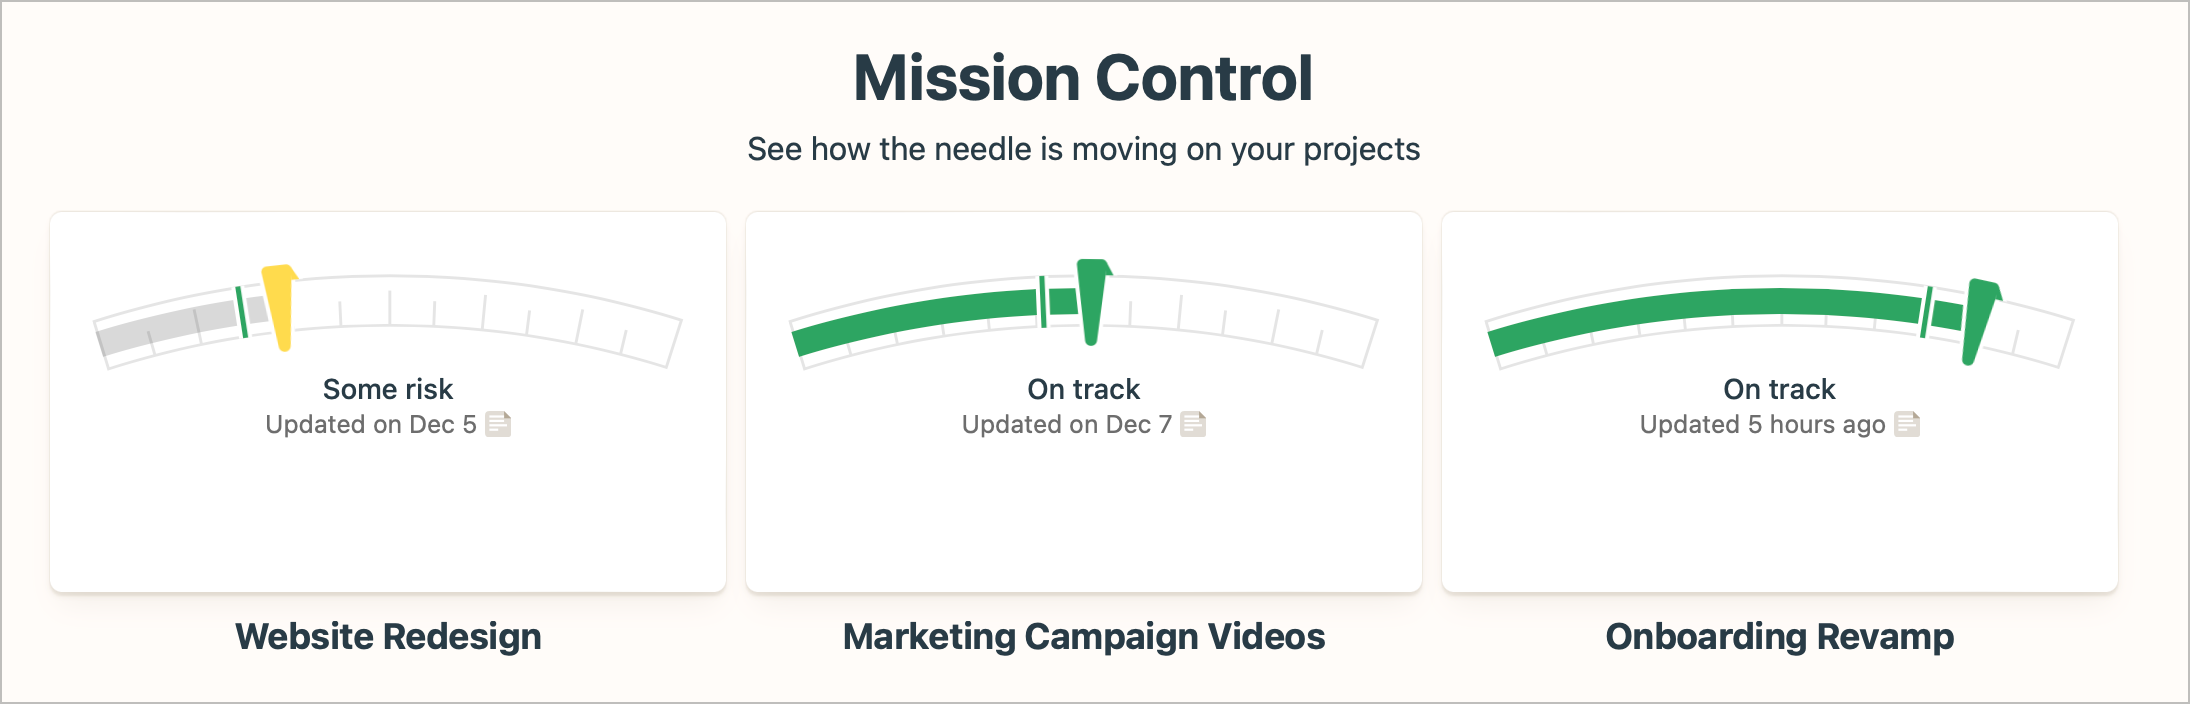
On a call with Jason, it finally clicked. "You know what we should do? The needle is already green. We should let you change it to yellow or red when something isn't going well." I laughed when I said it. We were far along in the project and it felt speculative. It couldn't be that simple, right?
That's where having someone to collaborate with is a boon. Jason immediately latched onto the idea, too. "No, that's great. We should totally do it." Within a day, we were using it on our projects. Now, I can't imagine Move the Needle without it.
Move the Needle and Mission Control were the result of months of conversations and debates. Once we started building, we iterated daily. Some things never changed, some went through many revisions, and some got dropped.
I love what we shipped. We brought something novel to Basecamp that solves a frequent pain point and the response from customers has been great.
I also love that it was a true collaboration, made better at every turn by having two heads instead of one.