Zero trading skills? No sweat! Building Blocks fast-tracks you to profits—crack options, read price moves, and unlock market secrets with my 5 pillars of trading. Transform how you see trading for a living. No nonsense, no fluff—just clear, actionable steps to get you winning. Start from scratch and build your trading career, let’s get started...
PART 1. OPTIONS UNRAVELED – YOUR FIRST STEP TO PROFITABILITY TRADING.
A stock option is like a coupon—it gives you the right, but not the pressure, to buy a stock at a set price (we call it the strike) by a certain date (that’s the expiration). Simple enough, right? Each option covers 100 shares, so it’s got some juice—think of it as a leveraged bet where a small move can mean big wins.
Now, options have two kinds of value: intrinsic and extrinsic. Intrinsic is the easy one—it’s what you’d pocket if the stock’s price is above the strike. Say your strike’s $50, the stock’s at $55—you’re “in the money,” and that $5 gap is yours. Extrinsic? That’s trickier—it’s the “time value,” the premium you pay for the clock still ticking. The more time left, the more it’s worth, because anything could happen. But it’s not just time—there’s this crew called the “Greeks” messing with it too.
Here’s the quick rundown on the four main Greeks—they’re like the weather report for your option’s vibe:
Delta: How much your option moves with the stock. A delta of 0.5 means a $1 stock jump bumps your option 50 cents. It’s your speedometer.
Gamma: The accelerator pedal for delta. If gamma’s 0.05, every $1 stock move tweaks delta by 0.05. It’s highest when your option’s close to the strike—nail-biting stuff.
Theta: The countdown clock. This is time decay eating your option’s value. The closer you get to expiration, the faster it melts—think of it like ice cream on a hot day.
Vega: The wild card. It tracks how much volatility shakes things up. Bigger swings in the stock’s expected chaos? Options get pricier—more chance to hit.
So why bother with options? Because they let you ride quick market waves with less cash on the line. Small risk, big reward potential—it’s like fishing with dynamite instead of a rod. That’s the hook. Next up, we’ll dig into how to pick your first trade without losing your shirt.
PART 2. PRICE ACTION AND CANDLESTICKS MADE SIMPLE.
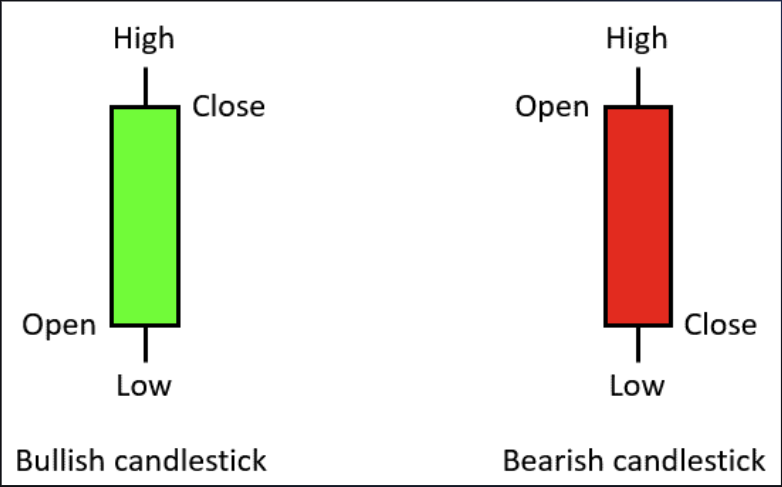
Price action is just the stock’s price moving over time, and it’s how we figure out what’s really going on in the market. It shows us trends, patterns, and whether the momentum’s strong or weak. Candlesticks? They’re like little snapshots of that action, telling us who’s winning—buyers or sellers. Let’s break it down.
Bullish Candlesticks (Buyers Are Taking Charge!)
Hammer Candle: Picture this—a stock’s been dropping, but then a hammer shows up. It’s got a small body and a long lower wick. That wick screams, “Sellers tried to tank it, but buyers swooped in and pushed it back up by the close.” It’s a bullish reversal hinting the downtrend might be over.
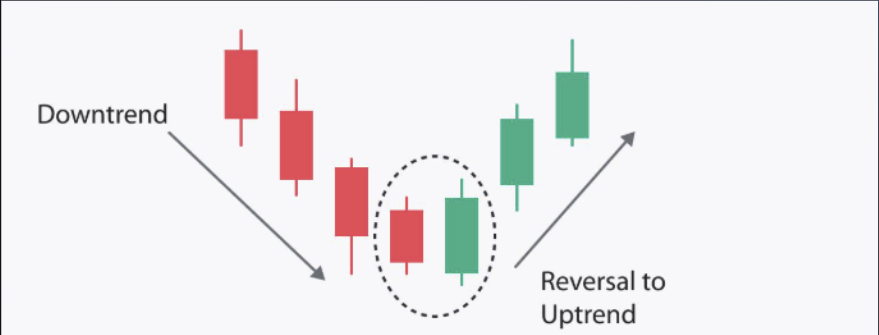
Bullish Engulfing Candle: This one’s cool. You see a tiny bearish candle (sellers in control), but the next day, bam—a big bullish candle swallows it whole. Buyers are saying, “Not today!” It’s a strong sign the tide’s turning up.
Bearish Candlesticks (Sellers Are Running the Show)
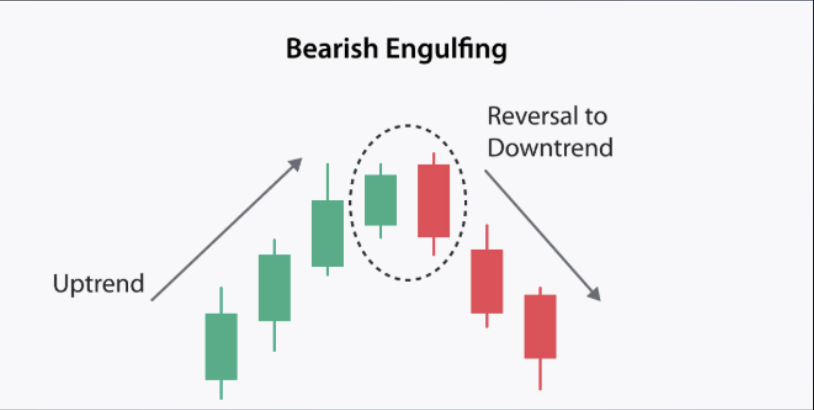
Bearish Engulfing Candle: Flip the script. A small bullish candle gets eaten by a bigger bearish one. Sellers are flexing, and it’s a clue the price might head south.
Shooting Star: This shows up after an uptrend. Small body, long upper wick—it’s like buyers pushed it up, but sellers slammed it back down by the close. A bearish reversal warning!
Neutral Candlesticks (Nobody’s Sure What’s Next)
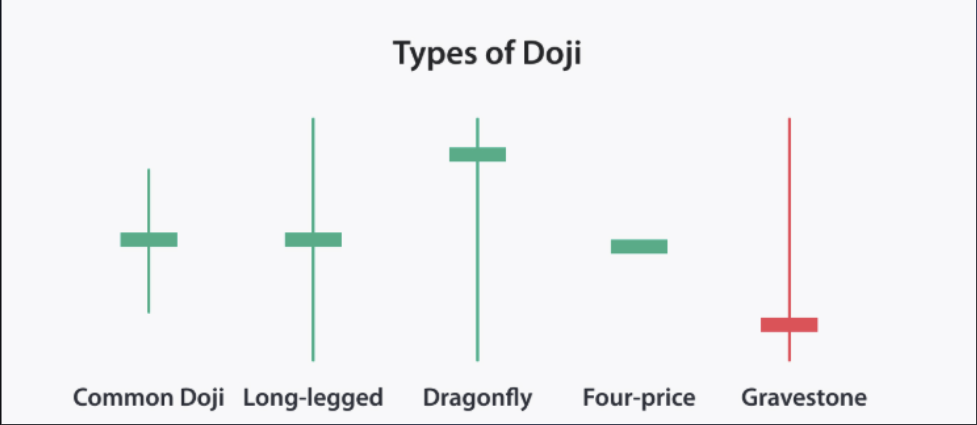
Doji Candle: The price opens and closes almost at the same spot. It’s a big “meh” from the market—indecision city.
Inside Day Candles: The price stays trapped inside the previous day’s high and low. If it happens two, three, or even four days in a row, it’s like the market’s holding its breath. Things are tight, and a breakout might be coming.
Spotting Trends (Where’s the Price Headed?)
Uptrend (Higher Highs & Higher Lows): The price keeps making higher peaks (highs) and higher dips (lows). Buyers are pumped, willing to pay more, and they’re stepping in early on pullbacks. That’s strength!
Downtrend (Lower Highs & Lower Lows): Now the peaks are lower, and the dips are deeper. Sellers are in control, pushing prices down even when the stock tries to rally. That’s bearish vibes.
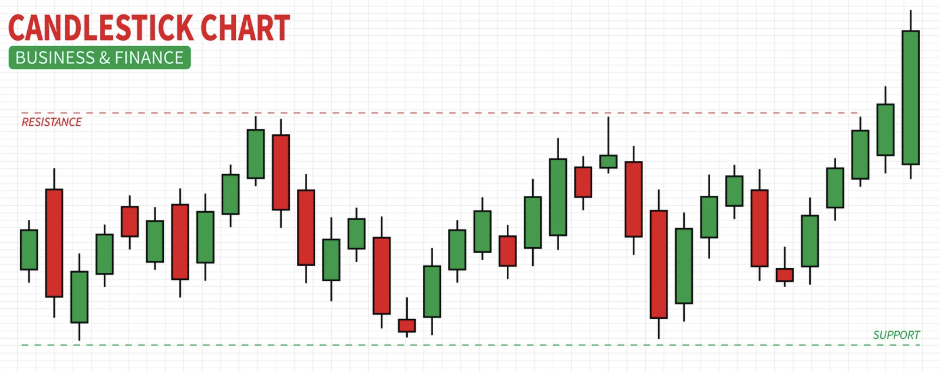
Support and Resistance (The Market’s Bounce and Block Zones)
Support: Think of this as a floor. When the price drops to this level, buyers jump in, creating demand that stops the fall. It’s where the stock tends to bounce back up.
Resistance: This is the ceiling. The price hits this level, and sellers pile in with supply, rejecting the climb. It’s where uptrends often hit a wall.
PART 3: MOVING AVERAGES AND VOLUME – YOUR TRADING SIDEKICKS
These aren’t magic wands—don’t let anyone hype them up like that—but they’re like trusty sidekicks that help us see what’s really driving the market. Let’s dive in!
Exponential Moving Average (EMA) – The Trend Spotter
The EMA is a moving average that puts more emphasis on recent prices, unlike the old-school simple moving average. Why’s that cool? It reacts faster to price changes, cutting down on lag so we can spot trends earlier. Perfect for us short-term traders! The catch? Sometimes it’s too quick and yells “trend!” when it’s just a fake spike. So, we’ll pair it with other clues to stay sharp.
Volume – The Muscle Behind the Move
Volume is just how many shares are traded—it’s the fuel behind price action. Big price moves with puny volume? Meh, they’re weak, like a car with no gas. But when you see a price jump and a volume spike? That’s conviction—buyers or sellers mean business. Watch for those spikes or weird volume shifts to back up what the price is telling us.
Candlesticks + Volume – A Power Combo
Remember those candlesticks from Part 2? They’re even better with volume in the mix. A hammer candle with crazy high volume? Buyers are charging in hard—bullish vibe! A shooting star with big volume? Sellers are stomping on the gas—bearish alert! Low volume on those patterns, though, and it’s like, “Eh, maybe not yet.” Volume’s our truth detector.
Smart Money Moves – Following the Big Players
Here’s where it gets juicy. Volume can clue us into what the “smart money”—those big institutional traders—is up to. They’ve got the muscle to nudge the market, and we can ride their coattails. Two key patterns to watch:
Accumulation: Institutions are quietly buying up shares, usually at the bottom of a range. You’ll see volume pop higher than normal—like they’re sneaking in the back door.
Distribution: They’re unloading shares at the top, often after a fake breakout that traps smaller traders. Volume spikes on those big down days show they’re cashing out.
Spot these, and you’re basically peeking at their playbook. A failed breakout with heavy volume? They’re grabbing liquidity and bailing. Price drops after, and volume screams “institutions are selling!” We can use this to stay on their side.
Price Action + Volume – The Full Picture
Now, let’s tie it all together. Start with price action—look for a range, a base, or tight consolidation, like a bull flag chilling out. Then check the volume. Is it building up quietly (accumulation)? Or spiking hard on a drop (distribution)? Pair that with your EMA to see the trend direction, and boom—you’ve got a solid read on what’s cooking.
Part 4: Patterns – Your Roadmap to Price Moves.
We’re talking patterns now—those shapes on the chart that tip us off to what’s coming next. They help us spot if a trend’s gonna keep rolling (continuation) or flip the script (reversal). As momentum swing traders, we’re all about those continuation patterns, but we’ll cover reversals too. Let’s break it down!
Continuation Patterns – The Trend Keeps Moving
These patterns show the price squeezing tight, like it’s coiling up for its next big move. Our favorites are:
Flags: Short, sharp consolidation after a big run—think of it like the price catching its breath before charging again.
Wedges: Slanted consolidation, sloping up or down, prepping for the next push.
Pennants: Tiny triangles after a spike, signaling more action’s on the way.
These are our bread and butter—they scream “trend’s not done yet!”
Reversal Patterns – The Trend’s About to Flip
Reversals are trickier, but here are the big four to know:
Head and Shoulders: Three peaks—two smaller ones (shoulders) and a big one in the middle (head). Price breaks below the “neckline” (the lows between them), and it’s bearish city—uptrend’s toast.
Inverse Head and Shoulders: Flip it upside down. Three dips—head’s the deepest, shoulders shallower. Price breaks above the neckline, and we’re going bullish!
Double Bottom: Looks like a “W.” Price drops, bounces, drops again to the same spot, then surges up. Bullish reversal time.
Double Top: An “M” shape. Price hits a high twice, dips between, then crashes below the support. Bearish reversal’s on.
Using Patterns the Smart Way
Here’s the deal: patterns alone won’t cut it. They’re clues, not the whole puzzle. Continuation patterns show compression—tight price action that’s gonna explode into expansion. We want a piece of that! Reversal patterns need context too—don’t just trade the shape. Look at what the chart’s been doing before and layer in stuff from earlier lessons:
Volume (is it backing the move?),
Candlesticks (what’s the sentiment?),
Moving averages (where’s the trend?).
Two Ways to Play Patterns
Breakouts: Jump in when price busts above resistance or below support—especially with a volume spike. That’s the early ticket to a big move. Think flags or pennants popping loose—volatility expands, and we’re riding it.
Structure Trades: Buy or short at the pattern’s support/resistance before the breakout. Price might test those levels, giving you a heads-up it’s ready to roll. Sneaky, early entry!
Tying It All Together
Patterns are our setups now. Combine them with volume, candlesticks, and EMAs, and you’re building a killer strategy. Next step? Nailing those entries and sticking to the plan like glue. Discipline’s the name of the game—let’s keep stacking the wins over time.
Part 5: Mindset and Psychology – The Trader’s Secret Weapon.
We’ve got the tools, the patterns, the setups, but none of it works without the right headspace. Trading’s tough—it’s you, your money, and a rollercoaster of emotions. Let’s lock in a mindset that keeps us cool, disciplined, and winning over the long haul.
Trading’s Emotional AF—Here’s How We Tame It
Trading hits hard because it’s your cash on the line. Fear, greed, panic—it’s all there. Our mission? Make it as emotionless as possible. How? A rock-solid plan. Set rules—entry levels, exits, risk limits—and stick to them. Before the market opens, know your stocks and key levels. React to what price gives you, not what you wish for. Plan it, trade it, done.
Show Up, Do the Work
There’s no secret sauce. Success is about grinding—making a plan, watching the market, and stacking consistent profits. Find a strategy that fits you, tweak it, and execute. Start small, mess up, learn, repeat. No shortcuts, just effort.
Every Day’s a Fresh Start
Bad day? Don’t try to fix Monday’s losses on Tuesday—that’s a trap. Sizing up after a loss kills risk management. Trading’s a marathon, not a sprint—252 days a year to get it right. Take it one day at a time, max out the setups in front of you, and stay chill.
Don’t Dig a Hole
Losing streak? Trade smaller. Everyone slumps—it’s normal. Focus on getting back to green to rebuild confidence, then size up slowly. Chasing quick fixes turns a 10% loss into 50%. Slow down, enjoy the ride.
Let Price Lead, Not Your Ego
Forget predicting—our job’s to spot high-probability setups and manage risk. Losses happen; no one’s right 100% of the time. Accept it, keep them small, and learn. Price is boss—follow it, not your gut.
Know Yourself
Are you a fast swing trader? Slow and steady? Pick a style that clicks with your personality and master it. Staying in your lane keeps you locked in—comfort’s a superpower here.
Keep It Simple
You don’t need 50 strategies or 5,000 stocks. Nail a few killer setups and a handful of tickers you know inside out. Price has a vibe—get to know it. Start simple, get profitable, then expand.
Love the Process, Not the Profits
Focus on getting good—money follows skill. Build a strategy that’s yours, execute it like a pro, and consistency will pay off. This isn’t a get-rich-quick gig; it’s a lifetime hustle.
Mindset > Everything
A strong mind beats a perfect plan every time. Without it, execution flops. Think like a pro trader—focus on preserving cash, not dreaming of yachts. Losses sting more than wins feel good—a $1,000 loss means you’ve got to make it back plus more. Discipline keeps you in the game.
Believe in You (But Check the Ego)
The market humbles everyone—ego’s a liability. Still, you’ve got to trust yourself. Plans are great, but pulling the trigger with real money takes guts. Start small, build confidence, and go. Bonus tip: Read Trading in the Zone by Mark Douglas—it’s your trading bible.
That’s it—Building Blocks! You’ve got the tools and the mindset to crush it. Trading’s a wild ride, but stick with it, stay disciplined, and you’ll come out on top. Want to dive deeper into how I trade? Book a session with me—we’ll go in-depth at your pace and get you dialed in. Ready to hit the markets?
Here is where I show the raw, unfiltered truth of my trading life. From trade recaps to potential market plays, to my raw thoughts on where the market is heading, this isn't your typical finance blog; it's a dive into the gritty reality of trading through my eyes.
Expect real talk on how this game fucks with your head, the lifestyle it forces on you, and the measures I take to keep myself from losing it.
No financial advice here, just the straight-up journey of one trader's ups, downs, and all the lessons learned in between.